RAIS Radionuclide Risk Calculator User's Guide
Open All Sections | Close All Sections
1. Introduction
The purpose of this calculator is to assist Remedial Project Managers (RPMs), On Scene Coordinators (OSC’s), risk assessors and others involved in decision-making at hazardous waste sites and to determine whether levels of contamination found at the site may warrant further investigation or site cleanup, or whether no further investigation or action may be required.
The risk values presented on this site are radionuclide-specific values for individual contaminants in air, water, soil and biota that may warrant further investigation or site cleanup.
It should be noted that the risks in this calculator are based upon human health risk and do not address potential ecological risk. Some sites in sensitive ecological settings may also need to be evaluated for potential ecological risk. EPA's guidance "Ecological Risk Assessment Guidance for Superfund: Process for Designing and Conducting Ecological Risk Assessment" contains an eight step process for using benchmarks for ecological effects in the remedy selection process. For ecological effects use the Ecological Benchmark tool on this site.
2. Understanding the Calculator Results
2.1 General Considerations
This portion of the risk assessment process is generally referred to as "Risk Characterization". This step incorporates the outcome of the previous activities and calculates the risk or hazard resulting from potential exposure to radionuclides via the pathways and routes of exposure determined appropriate for the source area.
The basic equation for calculating excess lifetime cancer risk is:
Risk = CDI × SF
where:
Risk = a unitless probability of an individual developing cancer over a lifetime;
CDI = chronic daily intake or dose [pCi, pCi-year/g, pCi-year/L, pCi-year/m3]
SF = slope factor, expressed in [risk/pCi or risk-g/pCi-year, risk-L/pCi-year, risk-m3/pCi-year]The risk results are color coded to identify risk ranges and potential radionuclides of concern. The colors and the associated risk ranges are presented in the table below.
Excess Lifetime Cancer Risk Risk Range Risk < 0.000001 Risk > 0.000001 Risk > 0.0001 Color Code No shading Orange Red 2.1.1 One-Hit Rule
The linear risk equation, listed above, are valid only at low risk levels (below estimated risks of 0.01). For sites where radiological exposure might be high (estimated risks above 0.01, an alternate calculation should be used. The one-hit equation, which is consistent with the linear low-dose model, should be used instead (RAGS, part A, ch. 8). The results presented on the RAIS use this rule. In the following instances, one-hit rule is used independently in our risk output tables:
Risk from a single exposure route for a single radionuclide. Summation of single radionuclide risk (without one-hit rule applied to single radionuclide results) for multiple exposure routes (right of each row). Summation of risk (without one-hit rule applied to single radionuclide results) from a single exposure route for multiple radionuclides (bottom of each column). Summation of total risk (without one-hit rule applied to single radionuclide results or summations listed above) from multiple radionuclides across multiple exposure routes (bottom right hand cell). 2.2 Exposure Assumptions
Risks are based on default exposure parameters and factors that represent Reasonable Maximum Exposure (RME) conditions for long-term/chronic exposures and are based on the methods outlined in EPA’s Risk Assessment Guidance for Superfund, Part B Manual (1991) and Soil Screening Guidance documents (1996 and 2002).
Site-specific information may warrant modifying the default parameters in the equations and calculating site-specific risks. In completing such calculations, the user should answer some fundamental questions about the site. For example, information is needed on the contaminants detected at the site, the land use, impacted media and the likely pathways for human exposure.
Whether these generic risks or site-specific risks are used, it is important to clearly demonstrate the equations and exposure parameters used in deriving risks at a site. A discussion of the assumptions used in the risk calculations should be included in the decision document for a CERCLA site.
2.3 Slope Factors (SFs)
EPA classifies all radionuclides as Group A carcinogens ("carcinogenic to humans"). Group A classification is used only when there is sufficient evidence from epidemiologic studies to support a causal association between exposure to the agents and cancer. The appendix radionuclide table, from the Center for Radiation Protection Knowledge, lists ingestion, inhalation and external exposure cancer slope factors (risk coefficients for total cancer morbidity) for radionuclides in conventional units of picocuries (pCi). Ingestion and inhalation slope factors are central estimates in a linear model of the age-averaged, lifetime attributable radiation cancer incidence (fatal and nonfatal cancer) risk per unit of activity inhaled or ingested, expressed as risk/pCi. External exposure slope factors are central estimates of lifetime attributable radiation cancer incidence risk for each year of exposure to external radiation from photon-emitting radionuclides distributed uniformly in a thick layer of soil and are expressed as risk/yr per pCi/gram soil. External exposure slope factors can also be used which have units of risk/yr per pCi/cm2 soil. When combined with site-specific media concentration data and appropriate exposure assumptions, slope factors can be used to estimate lifetime cancer risks to members of the general population due to radionuclide exposures. EPA currently provides guidance on inhalation risk assessment in RAGS Part F (Risk Assessment Guidance for Superfund Volume I: Human Health Evaluation Manual (Part F, Supplemental Guidance for Inhalation Risk Assessment). This guidance only addresses chemicals. The development of inhalation slope factors for radionuclides differs from the guidance presented in RAGS Part F for development of inhalation unit risk (IUR) values for chemicals.
The SFs from the Center for Radiation Protection Knowledge differ from the values presented in HEAST. The SFs were calculated using ORNL's DCAL software in the manner of Federal Guidance Report 12 and 13. The radionuclides presented are those provided in the International Commission on Radiological Protection (ICRP) Publication 107. This document contains a revised database of nuclear decay data (energies and intensities of emitted radiations, physical half-lives and decay modes) for 1,252 naturally occurring and manmade radionuclides. ICRP Publication 107 supersedes the previous database, ICRP Publication 38 published in 1983. In addition to radionuclides in ICRP Publication 107, the assembled data files or tables contain entries that include the contribution of daughter products in secular equilibrium with their longer-lived parents. These entries are identified by the addition of "+D" and to the nuclide name where "+D" refers to a 100 year period of progeny ingrowth.
2.3.1 When To Use "+D" Risk Exposure Models
Several of the isotopes are listed with a '+D' designation. This designation indicates that the slope factor includes the contribution from ingrowth of daughter isotopes out to 100 years. The intention of this designation is to make realistic risks by including the contributions from their short-lived decay products. The +D designation indicates that the parent radionuclide is accompanied by its progeny. In general, the activity of chain members assumes progeny ingrowth of 100 years. There is one exception for the inhalation slope factor for Rn-222+D. EPA assumes a 50% equilibrium value for radon decay products (Po-218, Pb-214, Bi-214 and Po-214) in air. Before applying risks to a site, it should be determined if the isotopes present are in secular equilibrium. If the isotopes are found to be in secular equilibrium, the +D risks should be used for the parent isotope and the daughters included in the +D can be ignored. If the isotopes are not in secular equilibrium, risks should be applied individually for each daughter isotope. However, in the absence of empirical data, the "+D" values for radionuclides should be used unless there are compelling reasons not to.
For example, if analytical data from a site reveal that Ra-226, Rn-222 and Po-218 are detected at a site and that they are in secular equilibrium, the risk for Ra-226+D should be applied and the Rn-222 and Po-218 can be ignored.
Another example could concern a decay chain in secular equilibrium like Th-228. Even though the decay chain for Th-228 is long, there is no Th-228+D slope factor because the activity of any of the progeny after 100 years of chain ingrowth was less than 90% of the parent's activity. The general rule for non-branching chains is, if a parent has any progeny with greater than 90% of the parent's activity at 100 years, a +D is calculated. For branching chains, if any branch contributes over 90% of the branch fraction activity, at 100 years, a +D is calculated. An example of this would be Cs-137+D where the branching fraction is 94.4 % to Ba-137m and at 100 years Ba-137m contributes over 90% of the activity than the parent, Cs-137. In either chain type, if the total dose contribution of the progeny is insignificant relative to the parent's contribution, then no +D values are calculated.
In this case of Th-228, the risks for Th-228, Ra-224+D, Po-216, Pb-212, Bi-212+D and Tl-208 should be used. If no part of the decay chain is in secular equilibrium, the user should use each of the risks for isotopes in the decay chain that have slope factors (e.g., Ra-224, Rn-220, Po-216, Pb-212, Bi-212, Po-212, and Tl-208). If part of the decay chain is in secular equilibrium, then the user may use that particular +D slope factor that covers that part of the decay chain, while using the slope factors for the other radionuclides.
2.3.2 Associated Decay Chains for "+D" Risk Exposure Models
Selected radionuclides and radioactive decay chain products are designated with the suffix "+D" to indicate that cancer risk estimates for these radionuclides include the contributions from their short-lived decay products, assuming equal activity concentrations (i.e., secular equilibrium) with the principal or parent nuclide in the environment. For all radionuclides without the "+D" suffix, only intake or external exposure to the single radionuclide is considered. Most radionuclides with a +D designation include the entire decay chain to the stable terminal nuclide in the slope factors. The Center for Radiation Protection Knowledge provides a table of the 100 year progeny ingrowth for the isotopes in Table 2 of Appendix A of Calculations of Slope Factors and Dose Coefficients. This table provides the associated decay chain used in the slope factors. This table is reproduced below for common isotopes with the terminal nuclide added.
Principal Radionuclide (half-life in years) Cs-137+D (30.2) Pu-239+D (2.41E+04) Ra-226+D (1.60E+03) Ra-228+D (5.75E+00) Rn-222+D (1.05E-02) Sr-90+D (28.8) Th-232+D (1.41E+10) U-235+D (7.04E+08) U-238+D (4.47E+09) 2.3.3 Metastable Isotopes
Most dose and risk coefficients are presented for radionuclides in their ground state. In the decay process, the newly formed nucleus may be in an excited state and emit radiation; e.g., gamma rays, to lose the energy of the state. The excited nucleus is said to be in a metastable state which is denoted by the chemical symbol and atomic number appended by "m"; e.g., Ba-137m. If additional higher energy metastable states are present then "n", "p", ... is appended. Metastable states have different physical half-lives and emit different radiations and thus unique dose and risk coefficients. In decay data tabulations of ICRP 107), if the half-life of a metastable state was less than 1 minute then the radiations emitted in de-excitation are included with those of the parent radionuclide. Click to see a graphical representation of the decay of Cs-137 to Ba-137.
Eu-152, in addition to its ground state has two metastable states: Eu-152m and Eu-152n. The half-lives of Eu-152, Eu-152m and Eu-152n are: 13.5 y, 9.31 m and 96 m, respectively and the energy emitted per decay is 1.30 MeV, 0.080 MeV, and 0.14 MeV, respectively.
2.4 Radionuclide-specific Parameters
Several radionuclide-specific parameters are needed for development of the risks. The parameters are selected from a hierarchy of sources.
2.4.1 Sources
Many sources are used to populate the database of radionuclide-specific parameters. They are briefly described below.
- IAEA TRS 472 (IAEA). Handbook of Parameter Values for the Prediction of Radionuclide Transfer in Terrestrial and Freshwater Environments. Technical Reports Series No. 472. International Atomic Energy Agency, Vienna. 2010. (IAEA TRS 364. Handbook of Parameter Values for the Prediction of Radionuclide Transfer in Temperate Environments (Technical Reports Series No. 364), 1994 was used to supplement egg, poultry and swine transfer factors.) Spreadsheet of values.
- NCRP 123 (NCRP). NCRP Report No. 123, Screening Models for Releases of Radionuclides to the Atmosphere, Surface Water, and Ground. National Council on Radiation Protection and Measurements. January 22, 1996. Spreadsheet of values.
- EPA Radionuclide Soil Screening Level (SSL). Soil Screening Guidance for Radionuclides: User's Guide. Office of Solid Waste and Emergency Response (OSWER) Directive 9355.4-16A. October 2000. Spreadsheet of values.
- RESRAD. User's Manual for RESRAD Version 6. Environmental Assessment Division, Argonne National Laboratory. July 2001. Spreadsheet of values.
- BAES. A Review and Analysis of Parameters for Assessing Transport of Environmentally Released Radionuclides through Agriculture. C. F. Baes III, R. D. Sharp, A. L. Sjoreen, R.W. Shor. Oak Ridge National Laboratory 1984. Spreadsheet of values.
- ICRP 107. Nuclear Decay Data for Dosimetric Calculations. International Commission on Radiological Protection Publication 107. Ann. ICRP 38 (3), 2008.
- EPAKD. Understanding Variation in Partition Coefficient, Kd, Values. Volume II: Review of Geochemistry and Available Kd Values for Cadmium, Cesium, Chromium, Lead, Plutonium, Radon, Strontium, Thorium, Tritium (3H), and Uranium. Office of Air and Radiation. EPA 402-R-99-004B. August 1999. and Volume III: Review of Geochemistry and Available Kd Values for Americium, Arsenic, Curium, Iodine, Neptunium, Radium, and Technetium. Office of Air and Radiation. EPA 402-R-04-002C. July 2004. Spreadsheet of values.
2.4.2 Hierarchy by Parameter
Generally the hierarchies below are followed.
- Half-life (yr), Decay mode, Atomic weight, Atomic number and Decay energy. ICRP 107.
- Milk transfer factor (TFdairy (day/L). IAEA, NCRP, RESRAD, BAES. TFdairy is the volumetric activity density in milk (pCi/L) divided by the daily intake of radionuclide (pCi/day).
- Beef transfer factor (TFbeef (day/kg). IAEA, NCRP, RESRAD, BAES. TFbeef is the mass activity density in beef (pCi/kg fresh weight) divided by the daily intake of radionuclide (in pCi/d).
- Fish bioconcentration factor (BCF (L/kg). IAEA, RESRAD. BCF is the ratio of the radionuclide concentration in the fish tissue (pCi/kg fresh weight) from all exposure pathways relative to that in water (pCi/L).
- Poultry transfer factor (TFpoultry (day/kg). IAEA, RESRAD. TFpoultry is the mass activity density in poultry (pCi/kg fresh weight) divided by the daily intake of radionuclide (in pCi/d).
- Egg transfer factor (TFegg (day/kg). IAEA, RESRAD. TFegg is the mass activity density in egg (pCi/kg fresh weight) divided by the daily intake of radionuclide (in pCi/d).
- Swine transfer factor (TFswine (day/kg). IAEA, RESRAD. TFswine is the mass activity density in swine (pCi/kg fresh weight) divided by the daily intake of radionuclide (in pCi/d).
- Soil to water partition coefficient (Kd (mg/kg-soil per mg/L water or simplified = L/kg). EPAKD, IAEA, SSL, RESRAD, BAES. (Kd is the ratio of the mass activity density (pCi/kg) of the specified solid phase (usually on a dry mass basis) to the volumetric activity density (Bq/L) of the specified liquid phase.
- Soil to plant transfer factor-wet (Bvwet (pCi/g plant per pCi/g soil). IAEA, NCRP, SSL, RESRAD, BAES. The values for cereal grain are used from IAEA. (Bvwet is the ratio of the activity concentration of radionuclide in the plant (pCi/kg wet mass) to that in the soil (pCi/kg dry mass). Note: Some Bvwet values were derived from Bvdry sources, assuming the ratio of dry mass to fresh mass was presented in the source documents.
- Soil to plant transfer factor-dry (Bvdry (pCi/g plant per pCi/g soil). IAEA, NCRP, SSL, RESRAD, BAES. The values for cereal grain are used. (Bvdry is the ratio of the activity concentration of radionuclide in the plant (pCi/kg dry mass) to that in the soil (pCi/kg dry mass). Note: Some Bvdry values were derived from Bvwet sources, assuming the ratio of dry mass to fresh mass was presented in the source documents.
Bvwet and Bvdry can be determined using the following equations.

and:
3. Understanding Your Site
The risk calculator provides generic concentrations in the absence of site-specific exposure assessments. These concentrations can be used for:
Prioritizing multiple sites within a facility or exposure units Setting risk-based detection limits for contaminants of potential concern (COPCs) Focusing future risk assessment efforts When appropriate for the site, consideration as risk-based cleanup levels
3.1 Developing a Conceptual Site Model
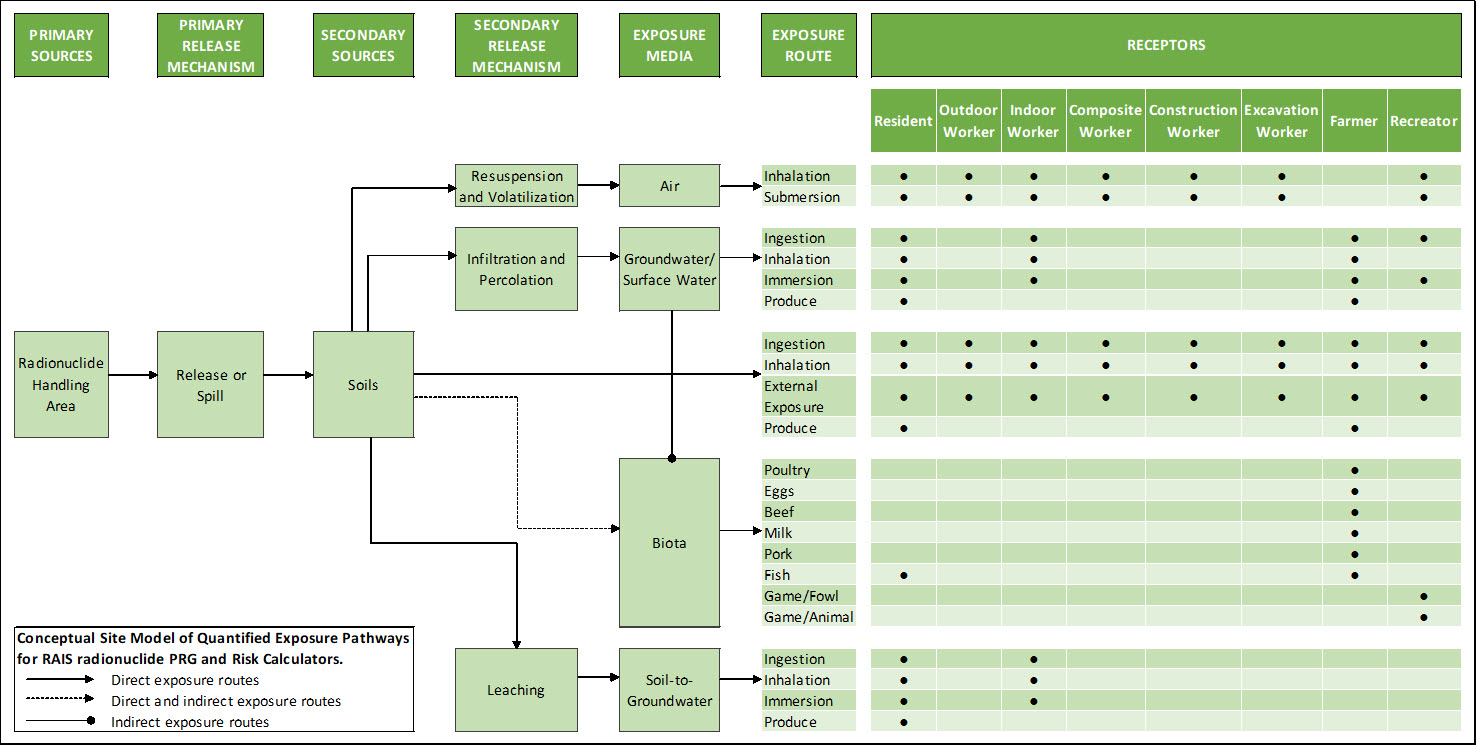
When using risks, the exposure pathways of concern and site conditions should match those taken into account by the screening levels. (Note, however, that future uses may not match current uses. Future uses of a site should be logical as conditions which might occur at the site in the future.) Thus, it is necessary to develop a conceptual site model (CSM) to identify likely contaminant source areas, exposure pathways, and potential receptors. This information can be used to determine the applicability of screening levels at the site and the need for additional information. The final CSM diagram represents linkages among contaminant sources, release mechanisms, exposure pathways, and routes and receptors based on historical information. It summarizes the understanding of the contamination problem. A separate CSM for ecological receptors can be useful. Part 2 and Attachment A of the Soil Screening Guidance for Radionuclides: Users Guide (EPA 2000a) contains the steps for developing a CSM.
As a final check, the CSM should answer the following questions:
A conceptual site model for the land uses presented in this calculator is presented below.
Are there potential ecological concerns? Is there potential for land use other than those listed in the risk calculator (i.e. , residential and industrial)? Are there other likely human exposure pathways that were not considered in development of the risks? Are there unusual site conditions (e.g. large areas of contamination, high fugitive dust levels, potential for indoor air contamination)? The risks may need to be adjusted to reflect the answers to these questions.
3.2 Background Radiation
Natural background radiation should be considered prior to applying risks as cleanup levels. Background and site-related levels of radiation will be addressed as they are for other contaminants at CERCLA sites. For further information, see EPA's guidance "Role of Background in the CERCLA Cleanup Program", April 2002, (OSWER 9285.6-07P). It should be noted that certain ARARs specifically address how to factor background into cleanup levels. For example, some radiation ARAR levels are established as increments above background concentrations. In these circumstances, background should be addressed in the manner prescribed by the ARAR.
3.3 Potential Problems and Limitations
As with any risk based tool, the potential exists for misapplication. In most cases, this results from not understanding the intended use of the risks. In order to prevent misuse of the risks, the following should be avoided:
Applying risk levels to a site without adequately developing a conceptual site model that identifies relevant exposure pathways and exposure scenarios. Use of risk levels as cleanup levels without the consideration of other relevant criteria such as ARARs. Use of risk levels as cleanup levels without verifying numbers with a health physicist/risk assessor. Use of outdated risk levels tables that have been superseded by more recent publications. Not considering the effects from the presence of multiple isotopes.
4. Land Use Descriptions, Equations, and Technical Documentation
The chronic daily intake (CDI) equations consider human exposure to individual contaminants in air, water, soil, sediment and biota. The technical discussion is aimed at producing risk results. The following text presents the land use equations and their exposure routes. The tables at the end of the users guide present the definitions of the variables and their default values. Any alternative values or assumptions used in developing risks on a site should be presented with supporting rationale in the decision documents.
The risk equations have evolved over time and are a combination of the following guidance documents:
Risk Assessment Guidance for Superfund: Volume I, Human Health Evaluation Manual (Part B, Development of Risk-based Preliminary Remediation Goals) (RAGS Part B). U.S. EPA. 2005. Human Health Risk Assessment Protocol for Hazardous Waste Combustion Facilities. Washington, DC. OSWER No. 5305W. EPA530-R-05-006 U.S. EPA. 2000a. Soil Screening Guidance for Radionuclides: User's Guide. Office of Emergency and Remedial Response and Office of Radiation and Indoor Air. Washington, DC. OSWER No. 9355.4-16A EPA/540-R-00-007 U.S. EPA. 2000b. Soil Screening Guidance for Radionuclides: Technical Background Document. Office of Emergency and Remedial Response and Office of Radiation and Indoor Air. Washington, DC. OSWER No. 9355.4-16 U.S. EPA 2002. Supplemental Guidance for Developing Soil Screening Levels for Superfund Sites. OSWER 9355.4-24. December 2002. U.S. EPA 1994b. Radiation Site Cleanup Regulations: Technical Support Documents for the Development of Radiation Cleanup Levels for Soil - Review Draft. Office of Radiation and Indoor Air, Washington, DC. EPA 402-R-96-011A. PDF document View Appendix C here. U.S. EPA. 1994c. Revised Draft Guidance for Performing Screening Level Risk Analyses at Combustion Facilities Burning Hazardous Wastes. Attachment C. Office of Emergency and Remedial Response. Office of Solid Waste. December 14. U.S. EPA. 1996a. Soil Screening Guidance: User's Guide. Office of Emergency and Remedial Response. Washington, DC. OSWER No. 9355.4-23 U.S. EPA. 1996b. Soil Screening Guidance: Technical Background Document. Office of Emergency and Remedial Response. Washington, DC. OSWER No. 9355.4-17A U.S. EPA. 1998. Human Health Risk Assessment Protocol for Hazardous Waste Combustion Facilities. Office of Solid Waste, Washington, DC. EPA530-D-98-001A. A secure PDF can be downloaded here. NCRP 1996. Screening Models for Releases of Radionuclides to Atmosphere, Surface Water, and Ground, Vols. 1 and 2, NCRP Report No. 123. National Council on Radiation Protection and Measurements.
4.1 Resident
4.1.1 Resident Soil
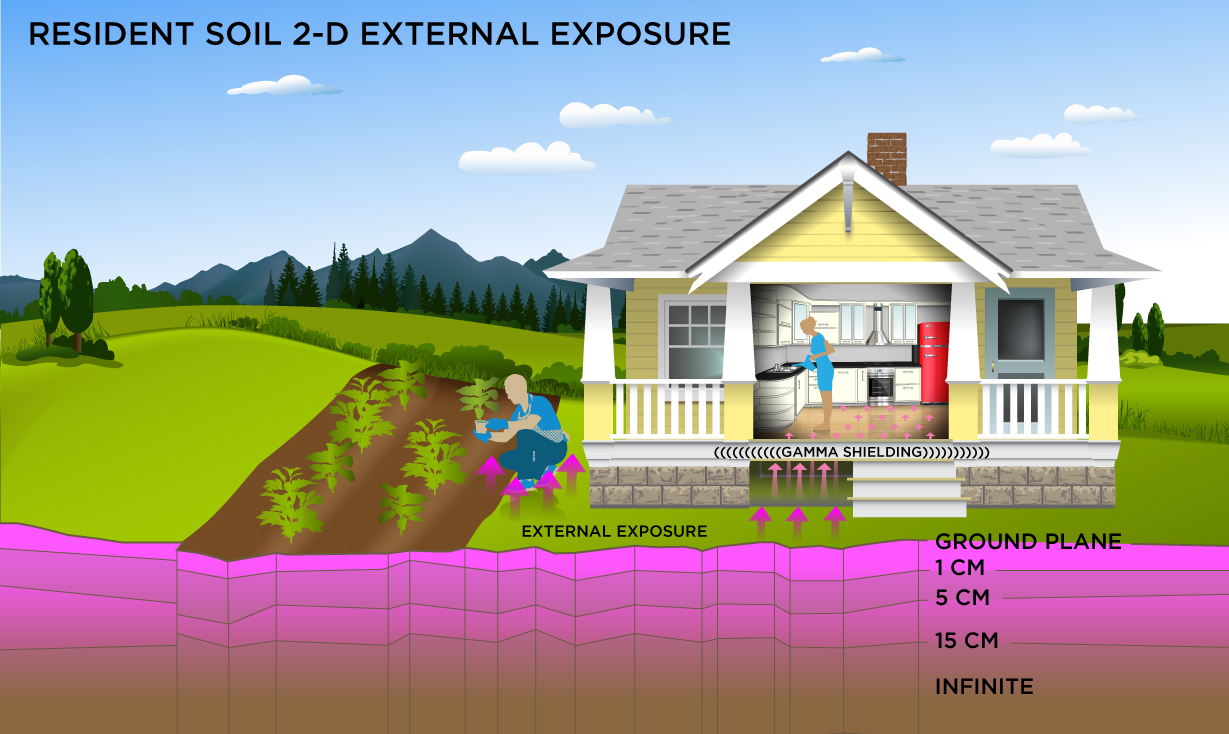
This receptor spends most, if not all, of the day at home except for the hours spent at work. The activities for this receptor involve typical home making chores (cooking, cleaning and laundering) as well as gardening. The resident is assumed to be exposed to contaminants via the following pathways: incidental ingestion of soil, external radiation from contaminants in soil, inhalation of fugitive dust and consumption of home grown produce (100% of fruit and vegetables). Adults and children exhibit different ingestion rates for soil and produce. For example the child resident is assumed to ingest 200 mg per day while the adult ingests 100 mg per day. To take into account the different intake rate for children and adults, age adjusted intake equations were developed to account for changes in intake as the receptor ages.
Equations
The residential soil land use equations, presented here, contain the following exposure routes:
incidental ingestion of soil,

inhalation of particulates emitted from soil and

external exposure to ionizing radiation.

ingestion of soil from the direct ingestion of produce.

direct ingestion of produce.

4.1.2 Resident Soil Alternate External Exposure Analysis
This receptor spends most, if not all, of the day at home except for the hours spent at work. The activities for this receptor involve typical home making chores (cooking, cleaning and laundering) as well as gardening.
This analysis is designed to look at external exposure from contamination of different area sizes. Areas considered are 1 to 1,000,000 square meters. Isotope-specific area correction factor (ACF) were developed for this analysis.
Equations
Direct External Exposure to contamination at infinite depth

Direct External Exposure to contamination at 1 cm

Direct External Exposure to contamination at 5 cm

Direct External Exposure to contamination at 15 cm

Direct External Exposure to contamination dust

4.1.3 Resident Air
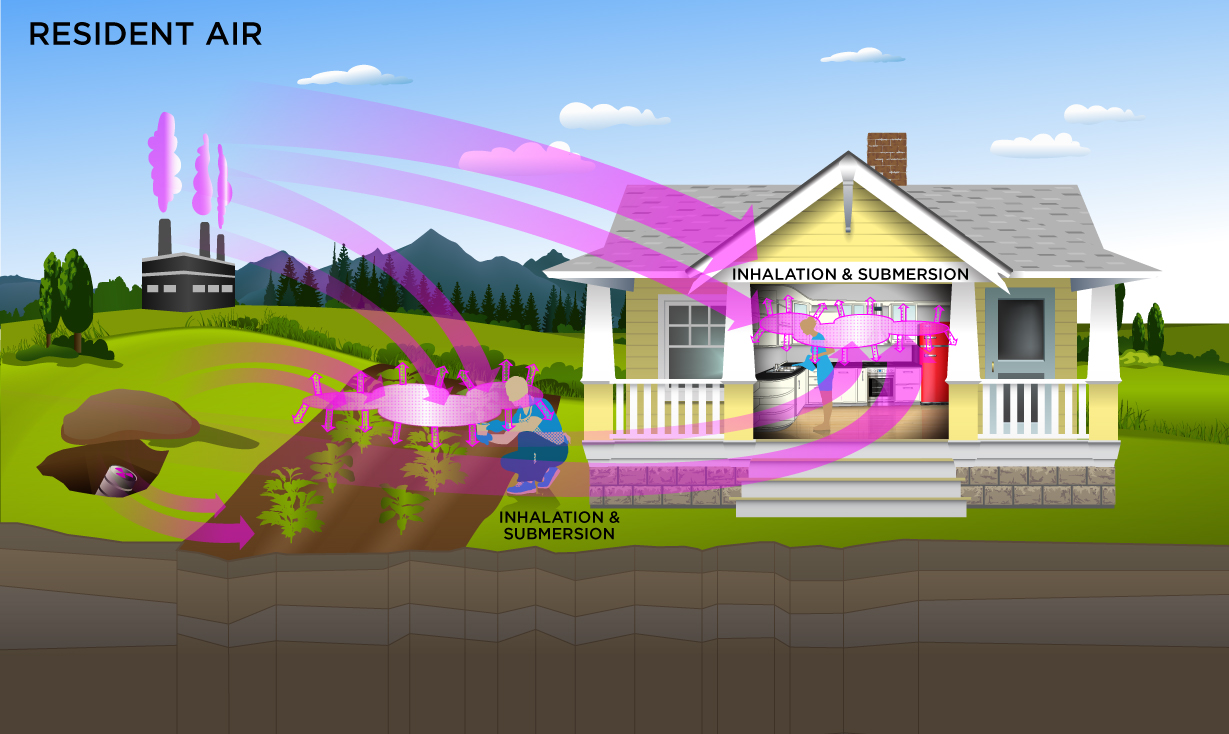
This receptor spends most, if not all, of the day at home except for the hours spent at work. The activities for this receptor involve typical home making chores (cooking, cleaning and laundering) as well as gardening. The resident is assumed to be exposed to contaminants via the following pathways: inhalation of ambient air and external radiation from contaminants in ambient air. To take into account the different inhalation rates for children and adults, age-adjusted intake equations were developed to account for changes in intake as the receptor ages.
Two ambient air exposure conditions are offered for this scenario. The first scenario includes a half-life decay function and the second scenario does not. In situations where the contaminant in the air is not being replenished (e.g., an accidental one-time air release from a factory), equations for the first scenario should be used. In situations where the contaminant in the air has a continual source (e.g., indoor radon from radium in the soil, or an operating factory or landfill cap), equations for the second scenario should be used.
Equations
With Decay
The residential ambient air land use equation, presented here, contains the following exposure routes with half-life decay:
inhalation with decay.

submersion with decay.

Without Decay
The residential ambient air land use equation, presented here, contains the following exposure routes without half-life decay:
inhalation without decay.

submersion without decay.

4.1.4 Resident Tap Water
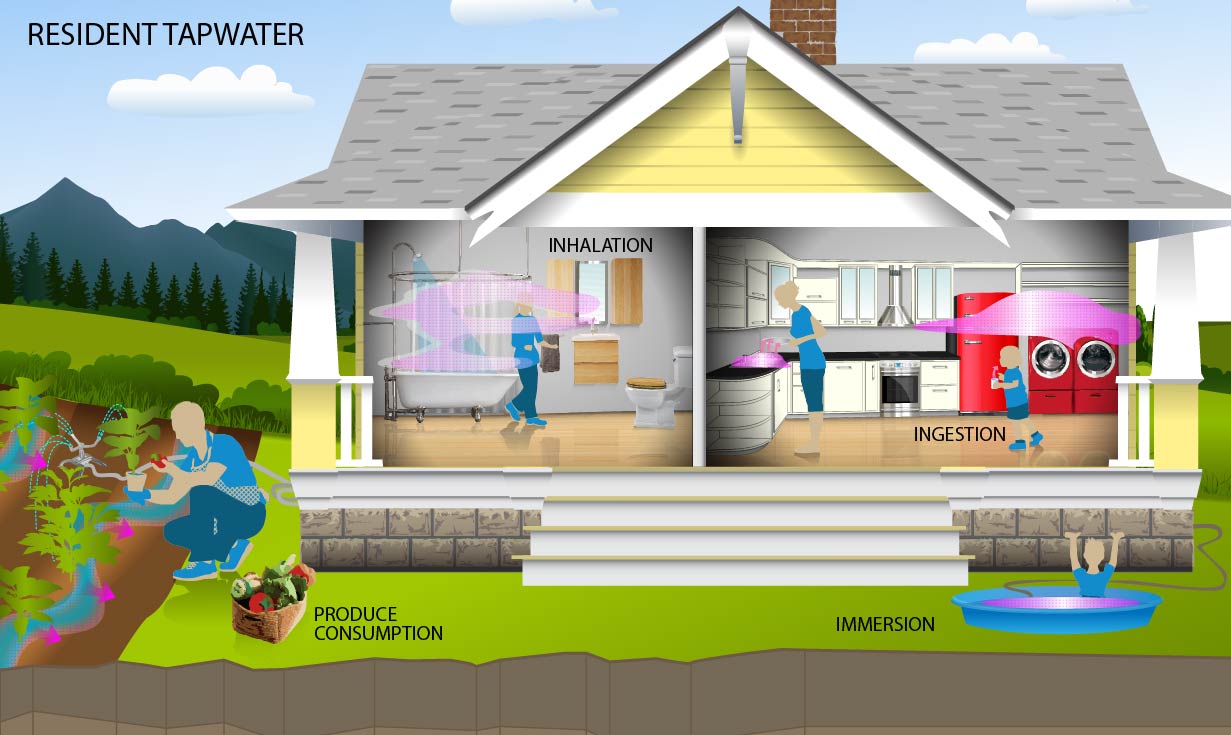
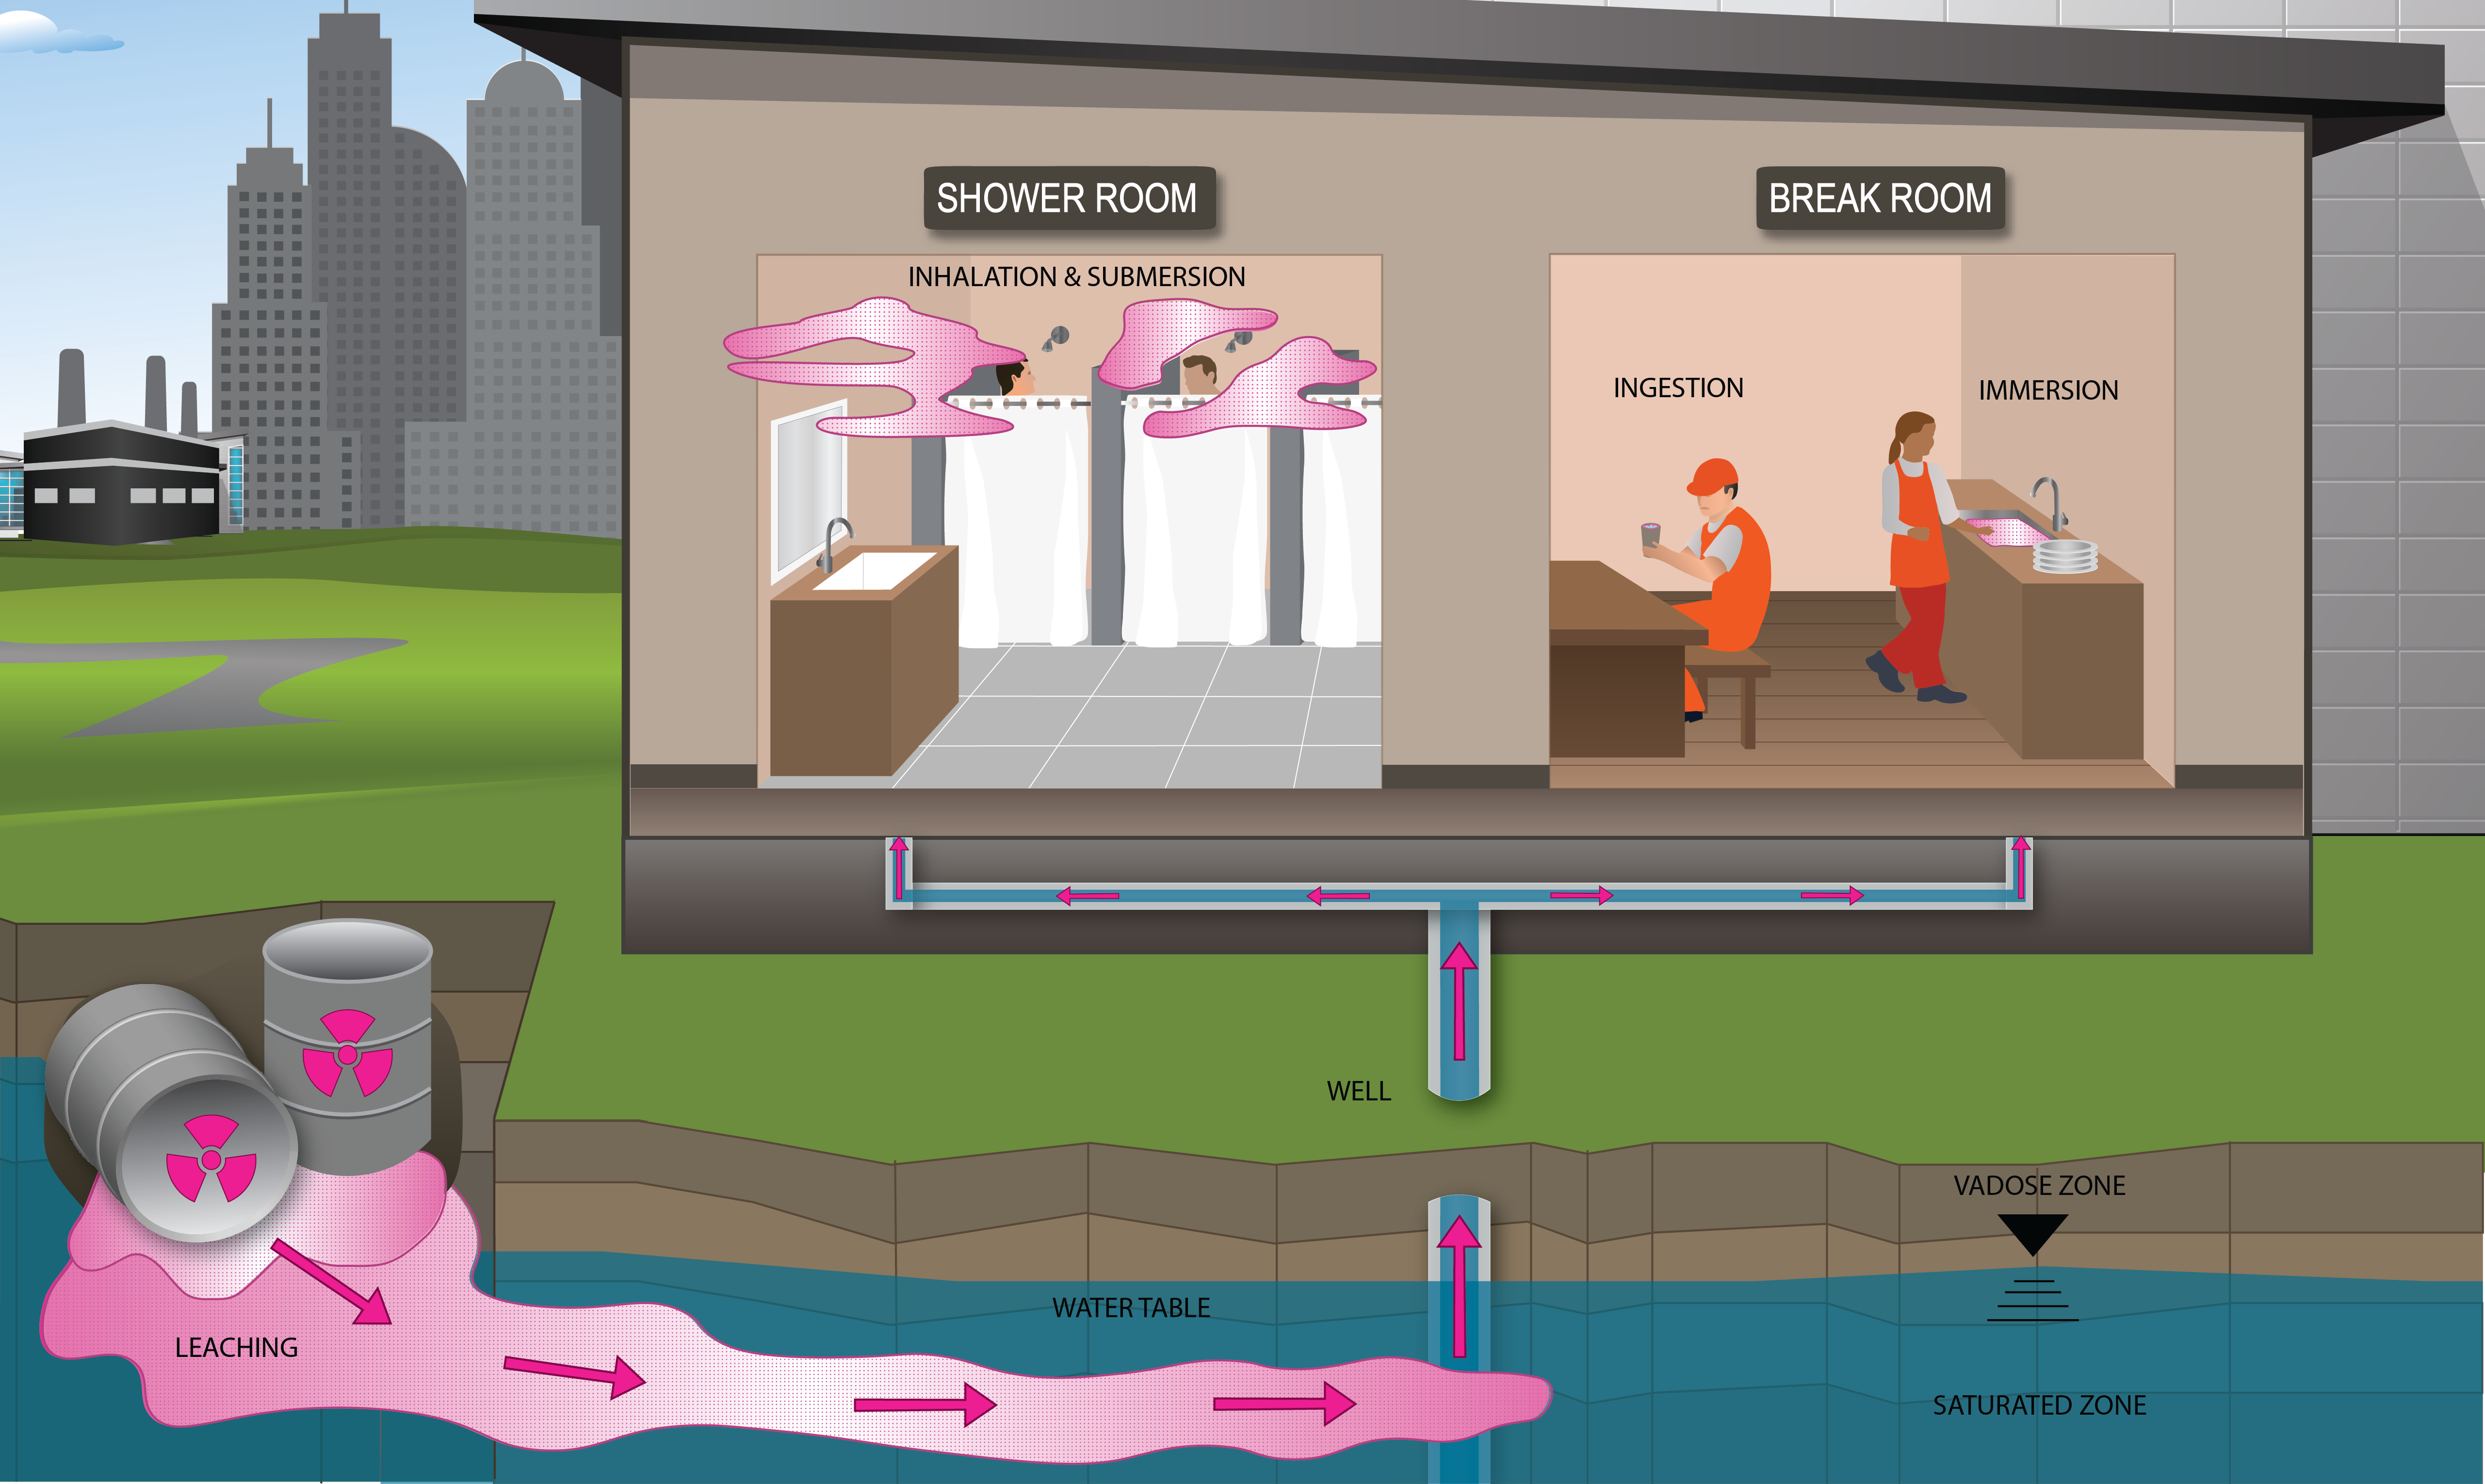
This receptor is exposed to radionuclides that are delivered into a residence. Ingestion of drinking water is an appropriate pathway for all radionuclides. Activities such as showering, laundering, and dish washing also contribute to inhalation. The inhalation exposure route is only calculated for C-14, H-3, Rn-220, and Rn-222 which volatilize. External exposure to immersion in tap water and exposure to produce irrigated with contaminated tap water are also considered. The submersion route is also included for radioactive gases in tap water. This addition was based on research found in ORNL/TM-2023/3001 - Quantifying the Impact of the Exclusion of the Submersion Exposure Route in Soil and Tap Water Models in Existing Superfund Radionuclide Screening Level Calculators.
Equations
The tap water land use equation, presented here, contains the following exposure routes:
ingestion of water

inhalation of volatiles (The inhalation exposure route is only calculated for C-14, H-3, Rn-220, Rn-222, and Rn-222+D). Also, volatilization in the equation comes from household uses of water (e.g., showering, laundering, dish washing)

submersion in volatiles (The submersion exposure route is only calculated for C-14, H-3, Rn-220, Rn-222, and Rn-222+D). Also, volatilization in the equation comes from household uses of water (e.g., showering, laundering, dish washing)

immersion in water

ingestion of tap water from direct ingestion of produce.

direct ingestion of produce.

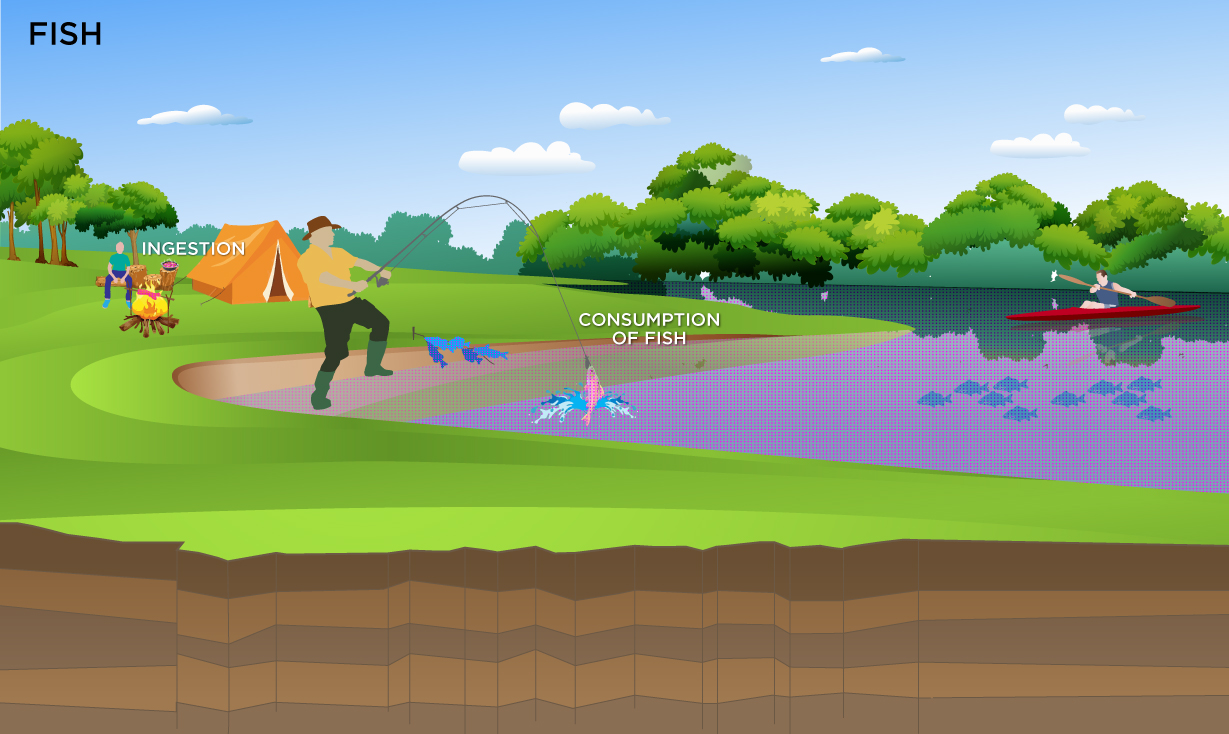
4.1.5 Consumption of Fish
The risk from consumption of fish is represented here. This is unlike the farmer scenario where the risk is calculated for soil levels protective of fish consumption. Further the ingestion rate is not age adjusted like the farmer scenario.
Equations
The consumption of fish equation, presented here, contains the following exposure routes:
Consumption of fish, concentration in fish.

consumption of fish. Concentration in Surface water.

Note: the consumption rate for fish is not age adjusted for this land use. Also the CDI calculated for fish is not for soil, like for the agricultural land uses, but is for fish tissue.
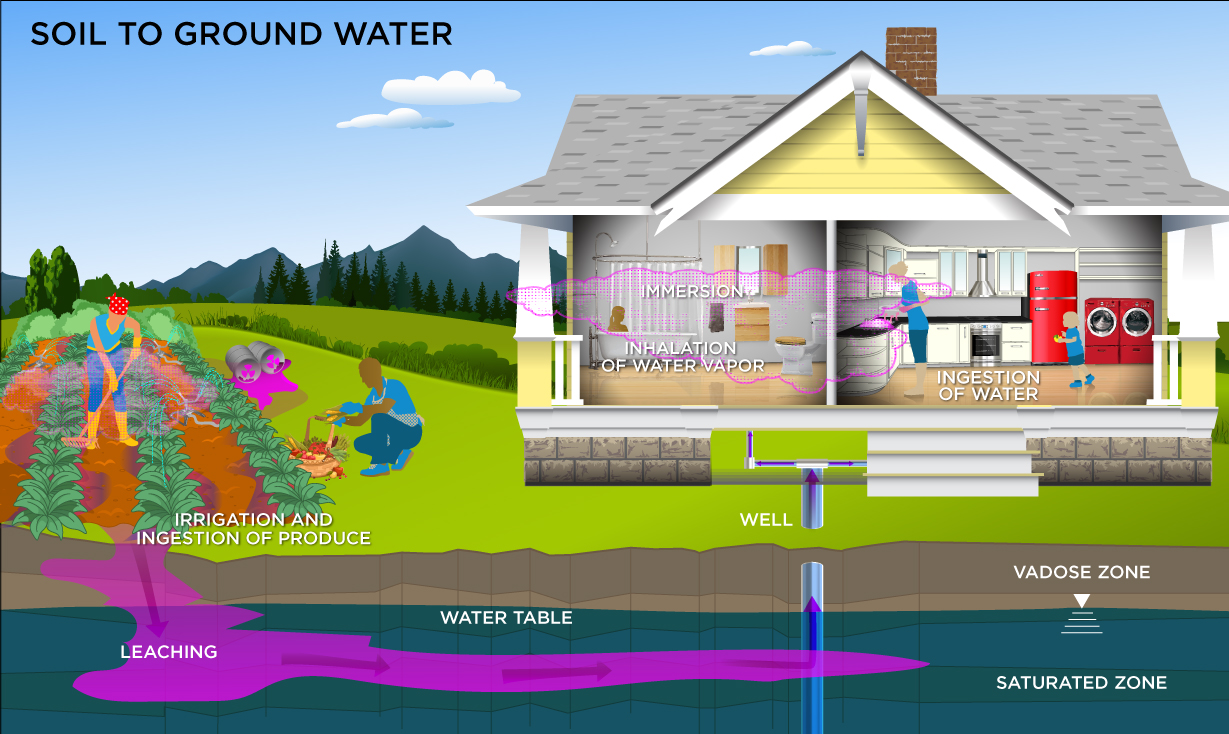
4.1.6 Soil to Groundwater
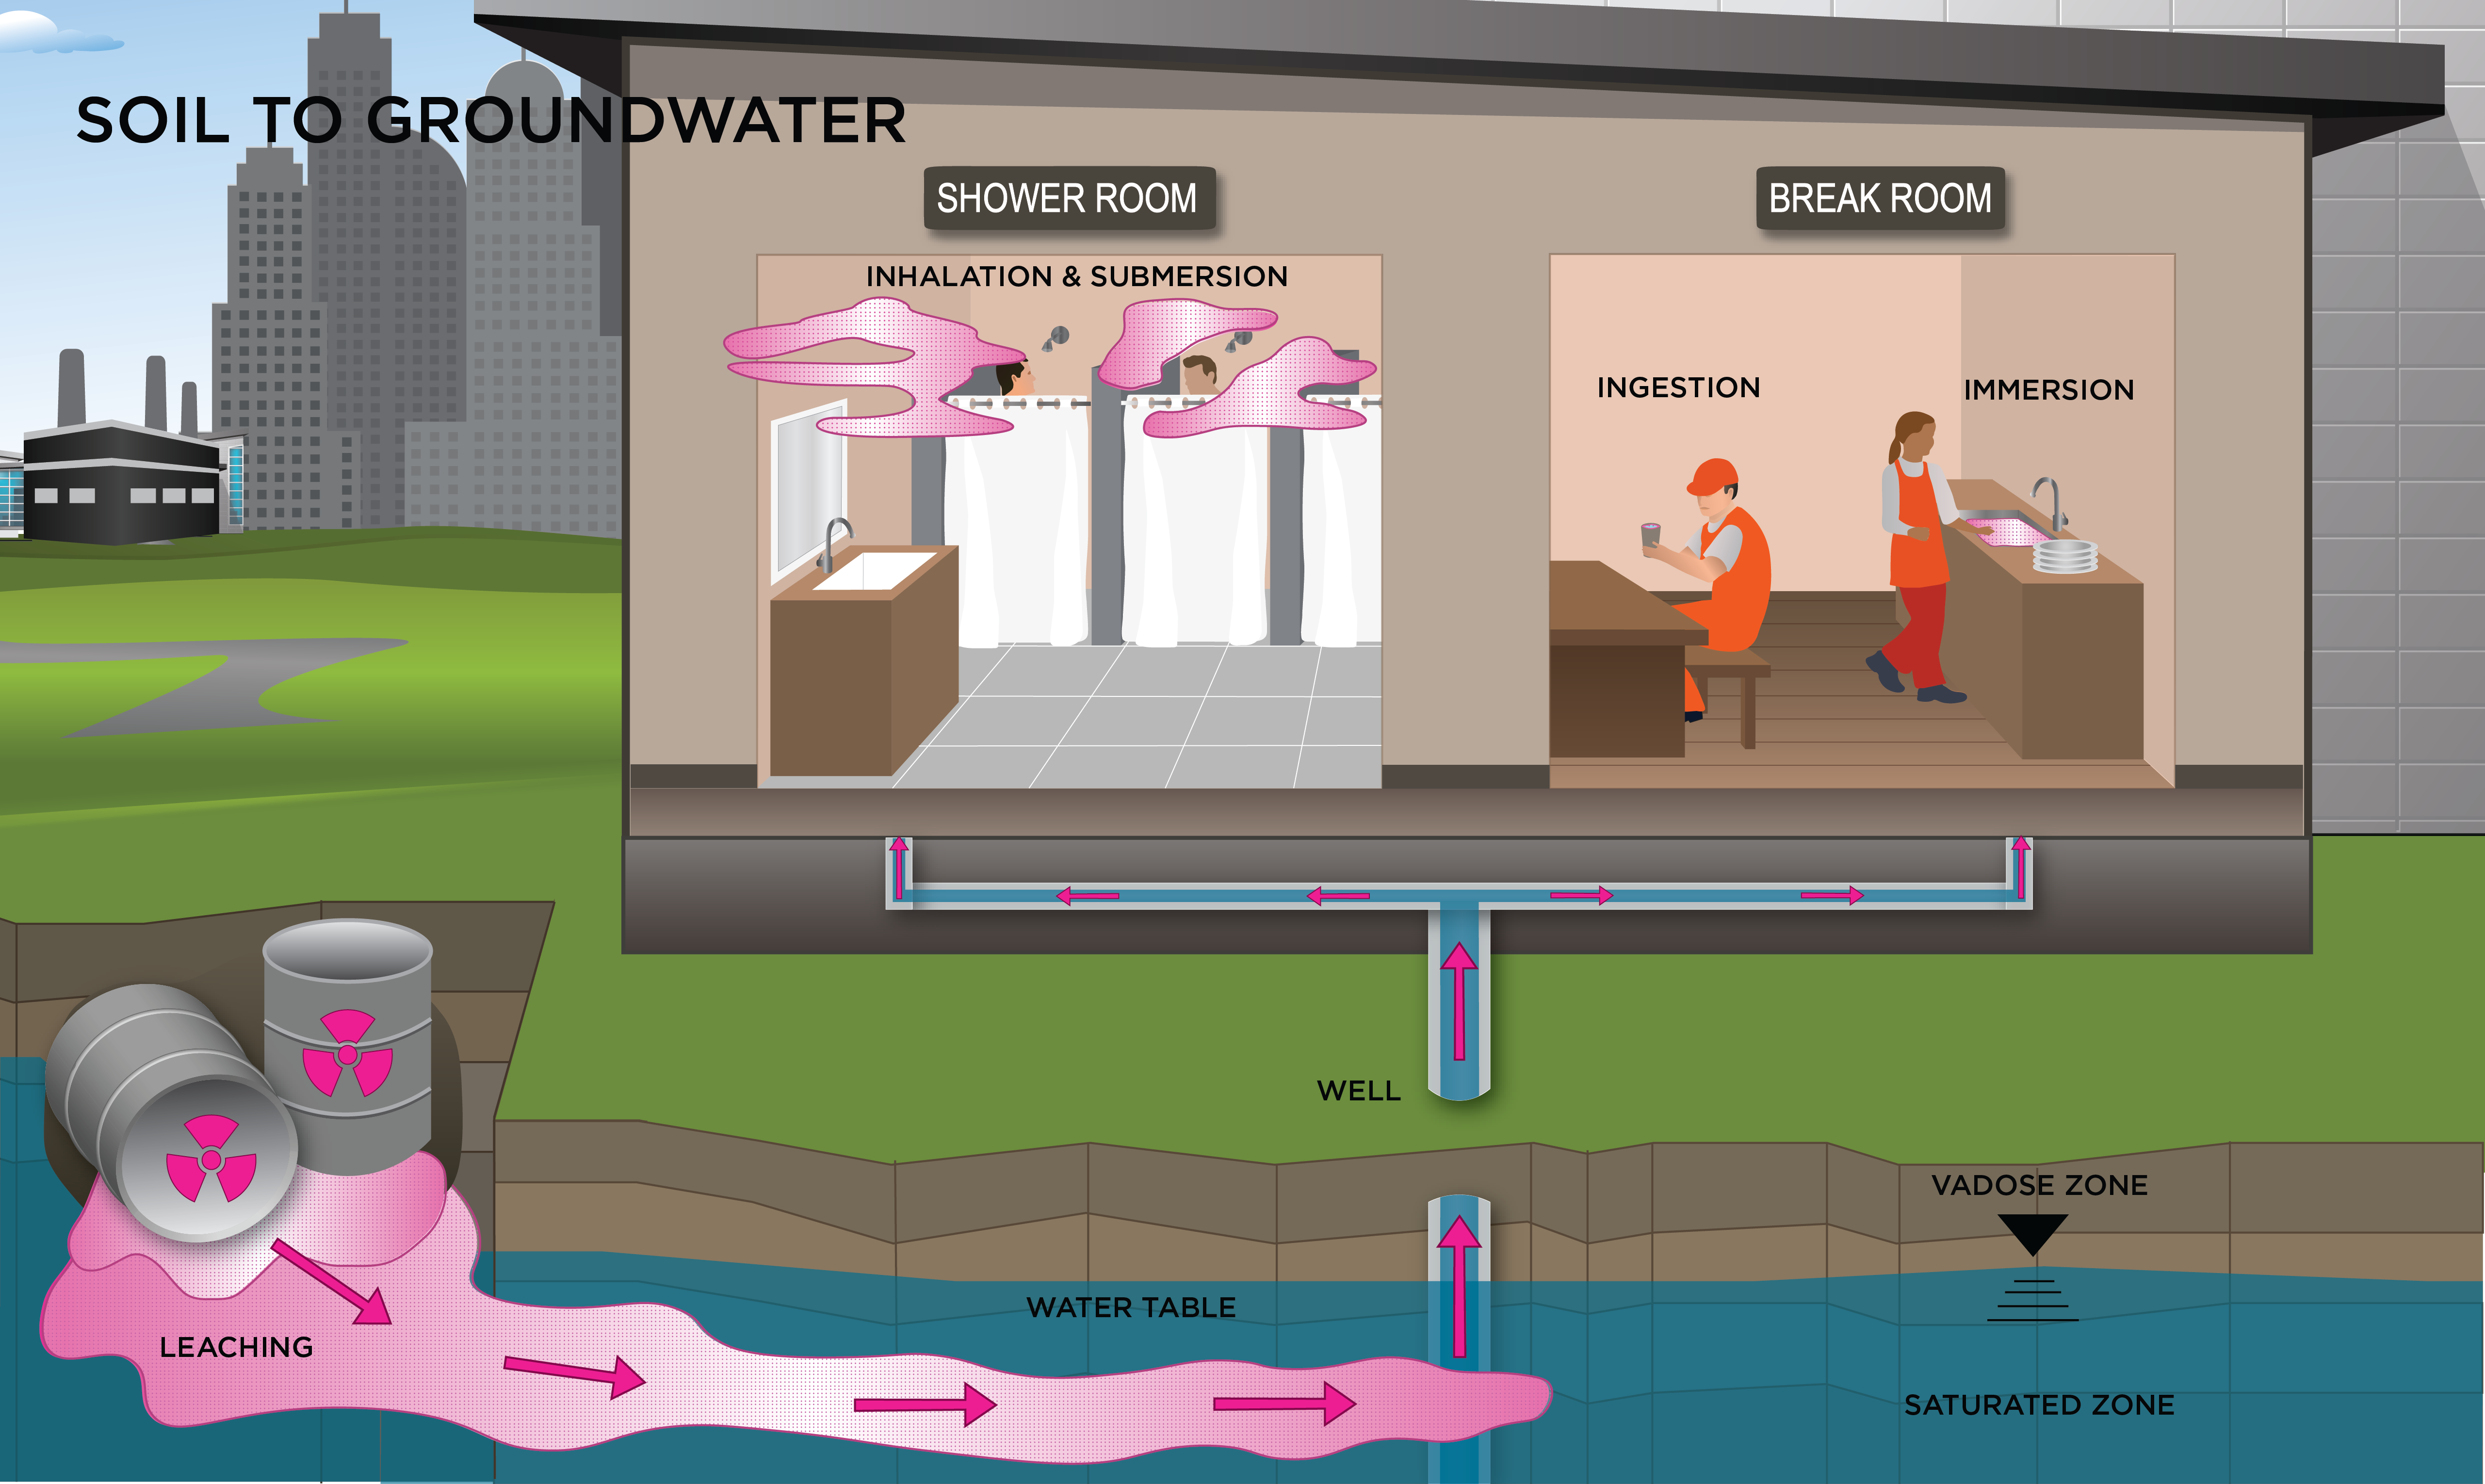
The soil to groundwater media uses the same water concentration determination equations for resident and indoor worker based on the respective soil concentration entered by the user for each land use. The graphical representation below illustrates the transport of contaminants from soil to groundwater for the resident land use. For more information about soil to groundwater, including equation images, please see section 4.9 of this user guide.
4.2 Indoor Worker
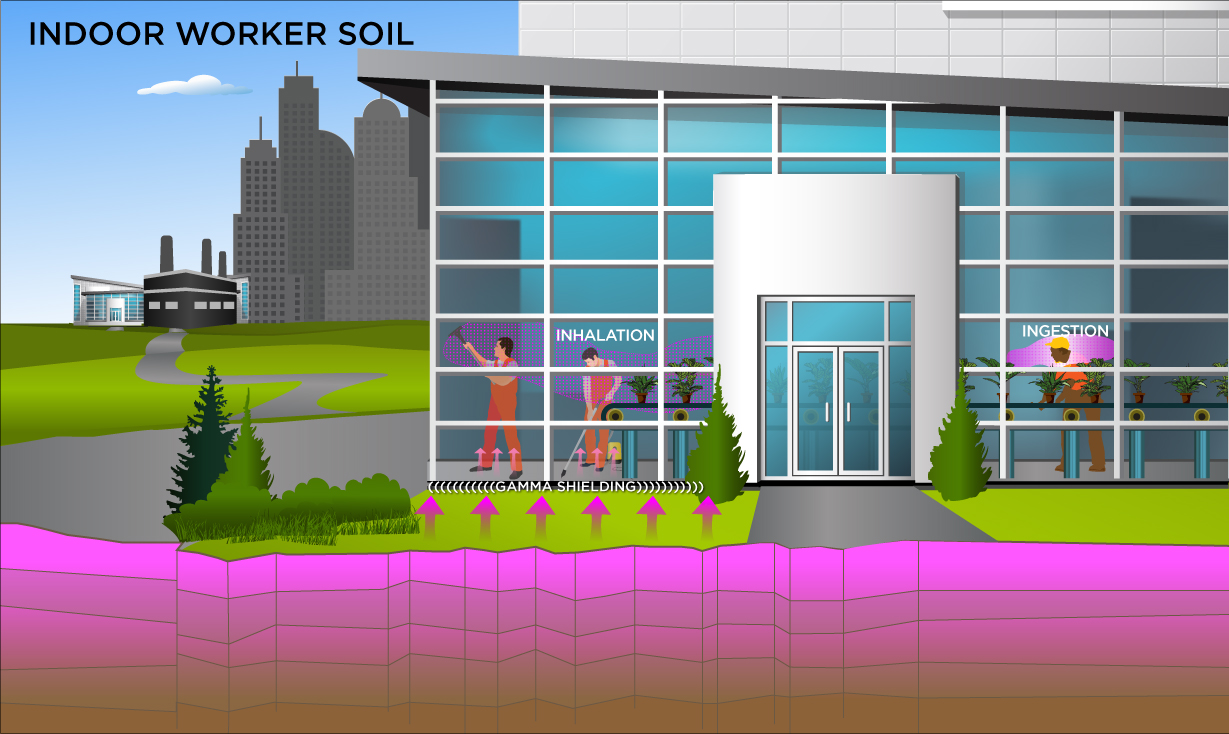
4.2.1 Indoor Worker Soil
This receptor spends most, if not all, of the workday indoors. Thus, an indoor worker has no direct contact with outdoor soils. This worker may, however, be exposed to contaminants through ingestion of contaminated soils that have been incorporated into indoor dust, external radiation from contaminants in soil, and the inhalation of contaminants present in indoor air. Risks calculated for this receptor are for both workers engaged in low intensity activities such as office work and those engaged in more strenuous activity (e.g., factory or warehouse workers).
Equations
The indoor worker soil land use equations, presented here, contain the following exposure routes:
incidental ingestion of soil,

inhalation of particulates emitted from soil, and

external exposure to ionizing radiation.

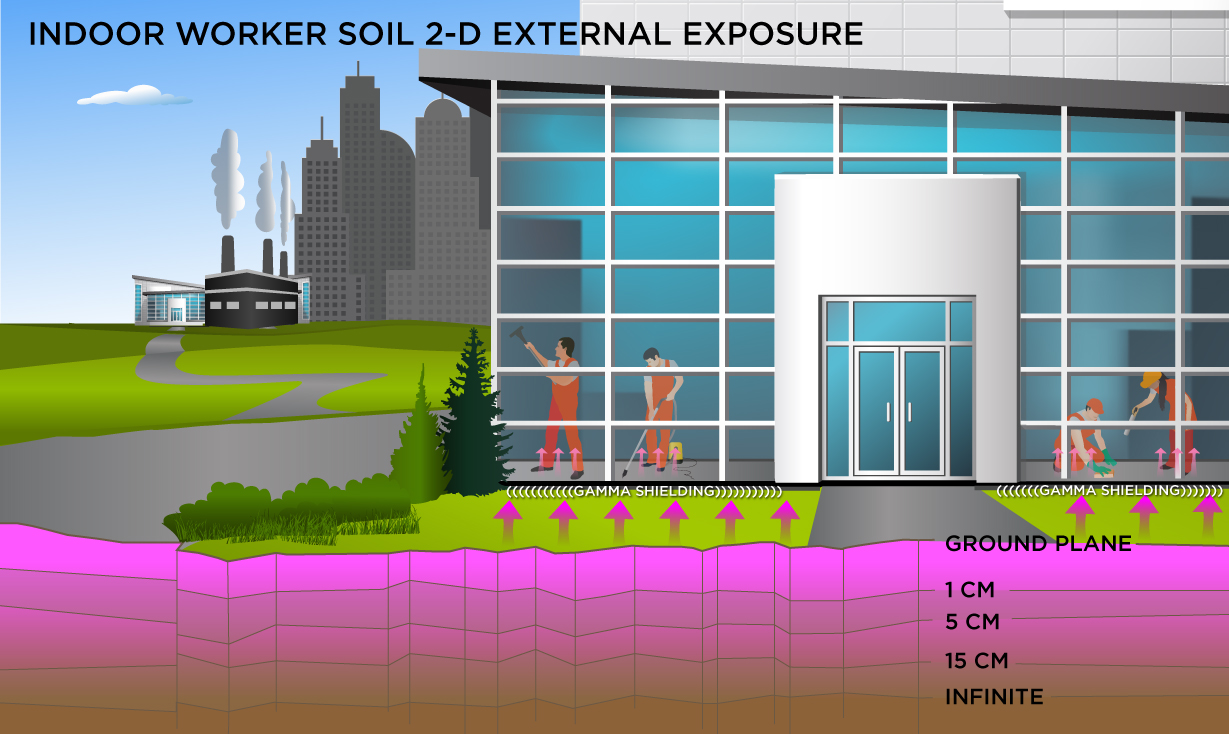
4.2.2 Indoor Worker Soil Alternate External Exposure Analysis
This receptor spends most, if not all, of the workday indoors. Thus, an indoor worker has no direct contact with outdoor soils. A gamma shielding factor is applied for this scenario to account for shielding provided by floors and foundation slabs.
This analysis is designed to look at external exposure from contamination of different area sizes. Areas considered are 1 to 1,000,000 square meters. Isotope-specific area correction factor (ACF) were developed for this analysis.
Equations
Direct External Exposure to contamination at infinite depth

Direct External Exposure to contamination at 1 cm

Direct External Exposure to contamination at 5 cm

Direct External Exposure to contamination at 15 cm

Direct External Exposure to contamination dust

4.2.3 Indoor Worker Air
This is a long-term receptor exposed during the work day who is a full time employee working on-site who spends most, if not all, of the workday indoors. The indoor worker is assumed to be exposed to contaminants via the following pathways: inhalation of ambient air and external radiation from contaminants in ambient air.
Two ambient air exposure conditions are offered for this scenario. The first scenario includes a half-life decay function and the second scenario does not. In situations where the contaminant in the air is not being replenished (e.g., an accidental one-time air release from a factory), equations for the first scenario should be used. In situations where the contaminant in the air has a continual source (e.g., indoor radon from radium in the soil, or an operating factory or landfill cap), equations for the second scenario should be used.
Equations
With Decay
The indoor worker ambient air land use equation, presented here, contains the following exposure routes with half-life decay:
inhalation and

submersion.

With Decay
The indoor worker ambient air land use equation, presented here, contains the following exposure routes with half-life decay:
inhalation and

submersion.

4.2.4 Indoor Worker Tap Water
This receptor spends most, if not all, of the workday indoors. This worker may be exposed to contaminants in tap water water. The worker may drink the water, take a shower, and inhale water vapors while showering or as part of industrial operations. Risks calculated for this receptor are for both workers engaged in low intensity activities such as office work and those engaged in more strenuous activity (e.g., factory or warehouse workers). The submersion route is also included for radioactive gases in tap water. This addition was based on research found in ORNL/TM-2023/3001 - Quantifying the Impact of the Exclusion of the Submersion Exposure Route in Soil and Tap Water Models in Existing Superfund Radionuclide Screening Level Calculators.
The indoor worker tap water land use equation, presented here, contains the following exposure routes:
Equations
The tap water land use equation, presented here, contains the following exposure routes:
ingestion of water and

inhalation, (The inhalation exposure route is only calculated for C-14, H-3, Rn-220, Rn-222, and Rn-222+D). Also, volatilization in the equation comes from household uses of water (e.g., showering, laundering, dish washing)

submersion, (The submersion exposure route is only calculated for C-14, H-3, Rn-220, Rn-222, and Rn-222+D). Also, volatilization in the equation comes from household uses of water (e.g., showering, laundering, dish washing)

external exposure.

4.2.5 Soil to Groundwater
The soil to groundwater media uses the same water concentration determination equations for resident and indoor worker based on the respective soil concentration entered by the user for each land use. The graphical representation below illustrates the transport of contaminants from soil to groundwater for the indoor worker land use. For more information about soil to groundwater, including equation images, please see section 4.9 of this user guide.
4.3 Outdoor Worker
4.3.1 Outdoor Worker Soil
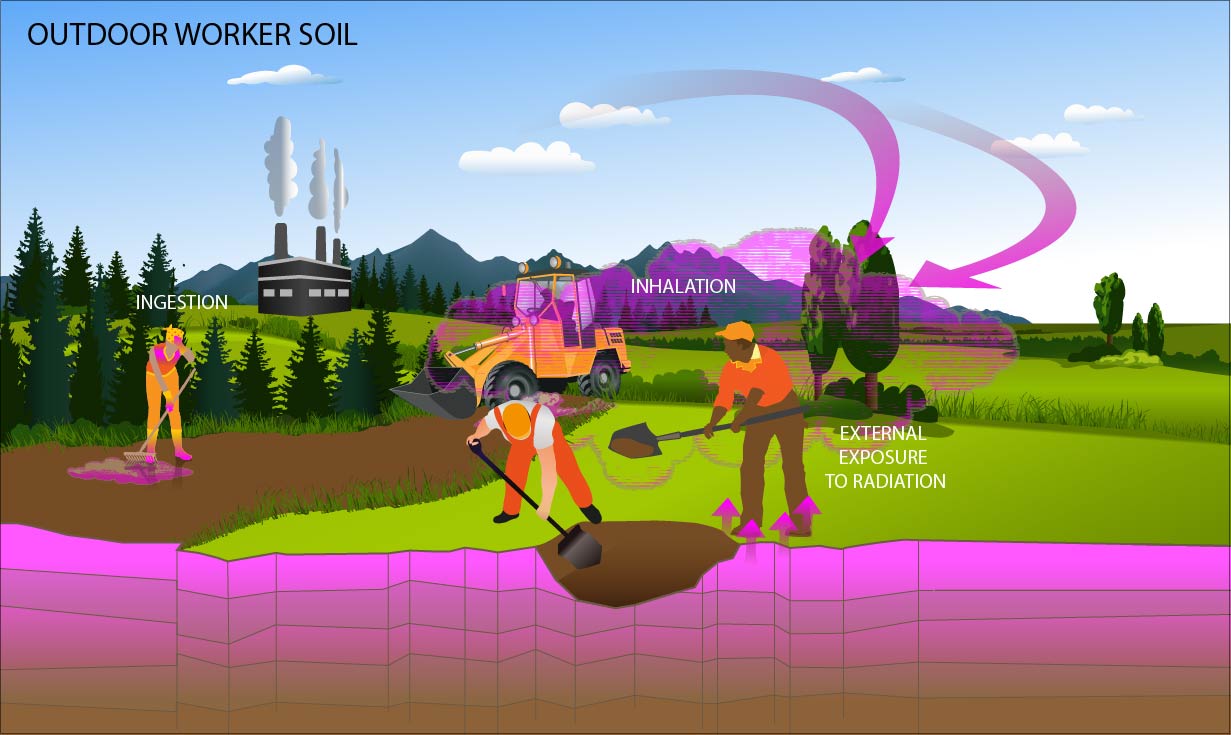
This is a long-term receptor exposed during the work day who is a full time employee working on-site and who spends most of the workday conducting maintenance activities outdoors. The activities for this receptor (e.g., moderate digging, landscaping) typically involve on-site exposures to surface soils. The outdoor worker is expected to have an elevated soil ingestion rate (100 mg per day) and is assumed to be exposed to contaminants via the following pathways: incidental ingestion of soil, external radiation from contaminants in soil, inhalation of fugitive dust. The outdoor worker receives more exposure than the indoor worker under commercial/industrial conditions.
Equations
The outdoor worker soil land use equations, presented here, contain the following exposure routes:
incidental ingestion of soil,

inhalation of particulates emitted from soil, and

external exposure to ionizing radiation.

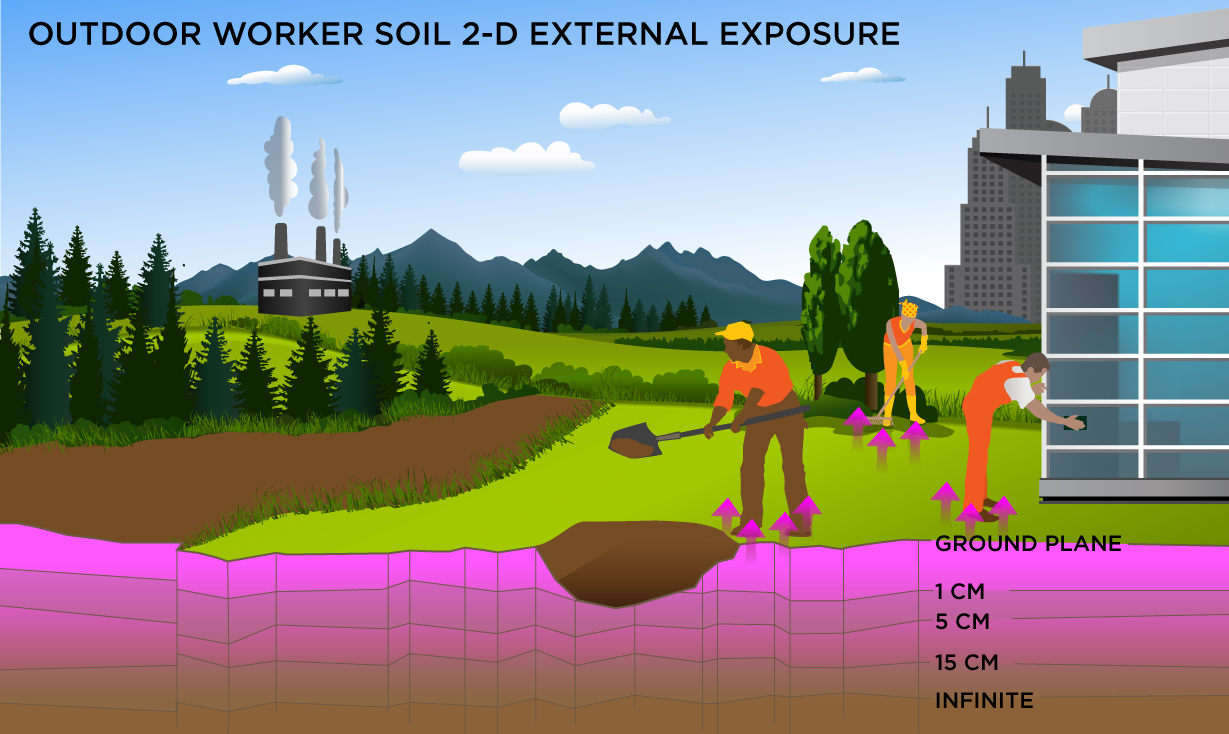
4.3.2 Outdoor Worker Soil Alternate External Exposure Analysis
This is a long-term receptor exposed during the work day who is a full time employee working on-site and who spends most of the workday conducting maintenance activities outdoors. The activities for this receptor (e.g., moderate digging, landscaping) typically involve on-site exposures to surface soils.
This analysis is designed to look at external exposure from contamination of different area sizes. Areas considered are 1 to 1,000,000 square meters. Isotope-specific area correction factor (ACF) were developed for this analysis.
Equations
Direct External Exposure to contamination at infinite depth

Direct External Exposure to contamination at 1 cm

Direct External Exposure to contamination at 5 cm

Direct External Exposure to contamination at 15 cm

Direct External Exposure to contamination dust

4.3.3 Outdoor Worker Air
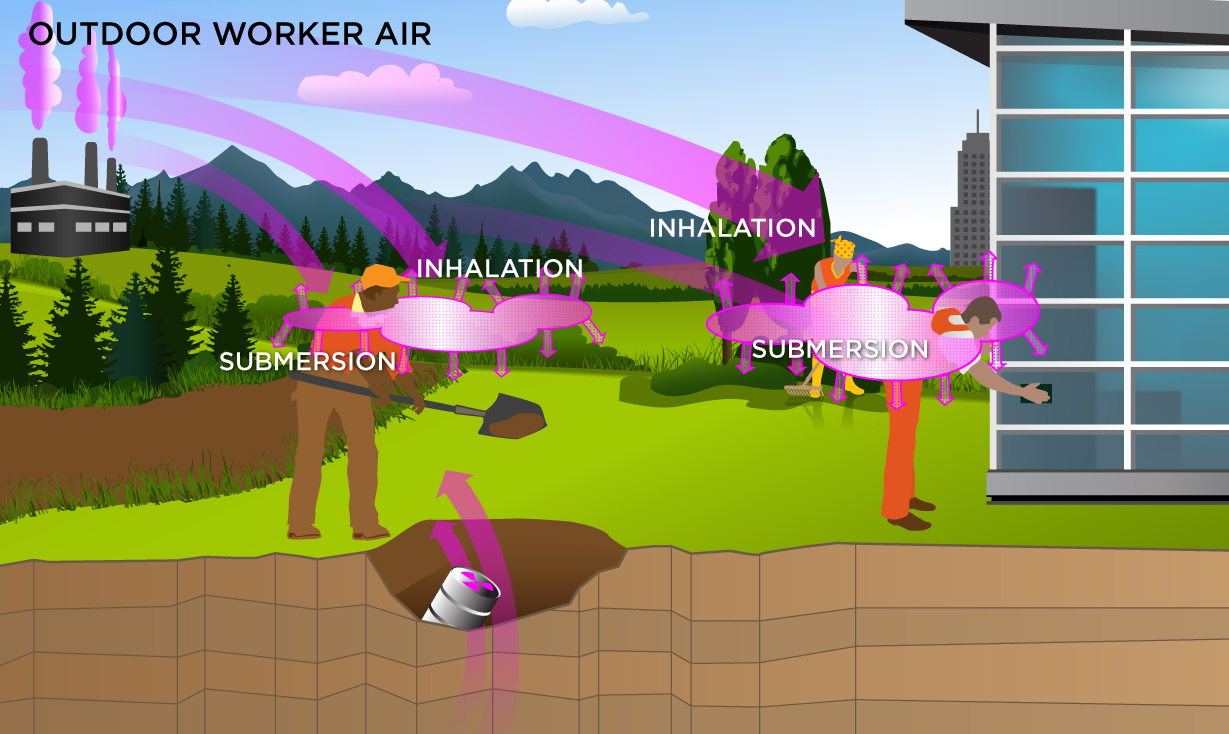
This is a long-term receptor exposed during the work day who is a full time employee working on-site and who spends most of the workday conducting maintenance activities outdoors. The activities for this receptor (e.g., moderate digging, landscaping) typically involve on-site exposures to surface soils. The outdoor worker is assumed to be exposed to contaminants via the following pathways: inhalation of ambient air and external radiation from contaminants in ambient air.
Two ambient air exposure conditions are offered for this scenario. The first scenario includes a half-life decay function and the second scenario does not. In situations where the contaminant in the air is not being replenished (e.g., an accidental one-time air release from a factory), equations for the first scenario should be used. In situations where the contaminant in the air has a continual source (e.g., indoor radon from radium in the soil, or an operating factory or landfill cap), equations for the second scenario should be used.
Equations
With Decay
The outdoor worker ambient air land use equation, presented here, contains the following exposure routes with half-life decay:
inhalation and

submersion.

Without Decay
The outdoor worker ambient air land use equation, presented here, contains the following exposure routes without half-life decay:
inhalation and

submersion.

4.4 Composite Worker
4.4.1 Composite Worker Soil
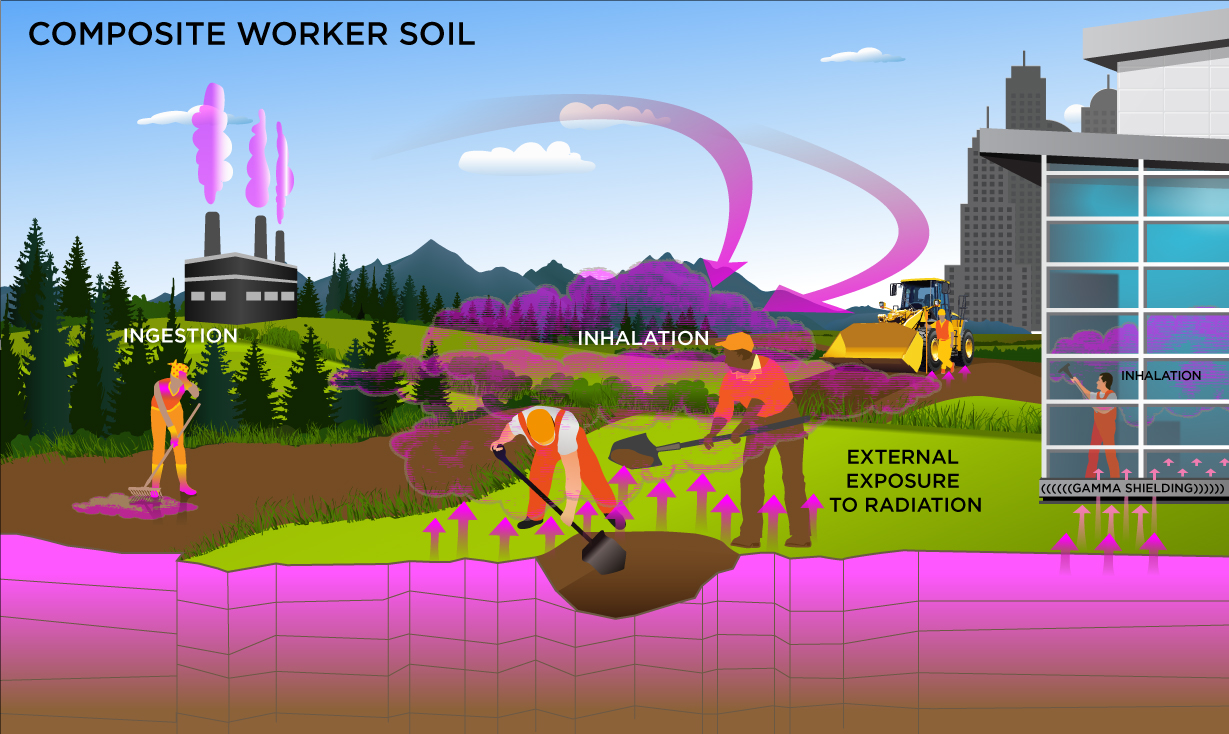
This is a long-term receptor exposed during the work day who is a full time employee working on-site and who spends most of the workday conducting maintenance activities outdoors. The activities for this receptor (e.g., moderate digging, landscaping) typically involve on-site exposures to surface soils. The composite worker is expected to have an elevated soil ingestion rate (100 mg per day) and is assumed to be exposed to contaminants via the following pathways: incidental ingestion of soil, external radiation from contaminants in soil, inhalation of fugitive dust . The composite worker combines the most protective exposure assumptions of the outdoor and indoor workers. The only difference between the outdoor worker and the composite worker is that the composite worker uses the more protective exposure frequency of 250 days/year from the indoor worker scenario.
Equations
The composite worker soil land use equations, presented here, contain the following exposure routes:
incidental ingestion of soil,

inhalation of particulates emitted from soil, and

external exposure to ionizing radiation.

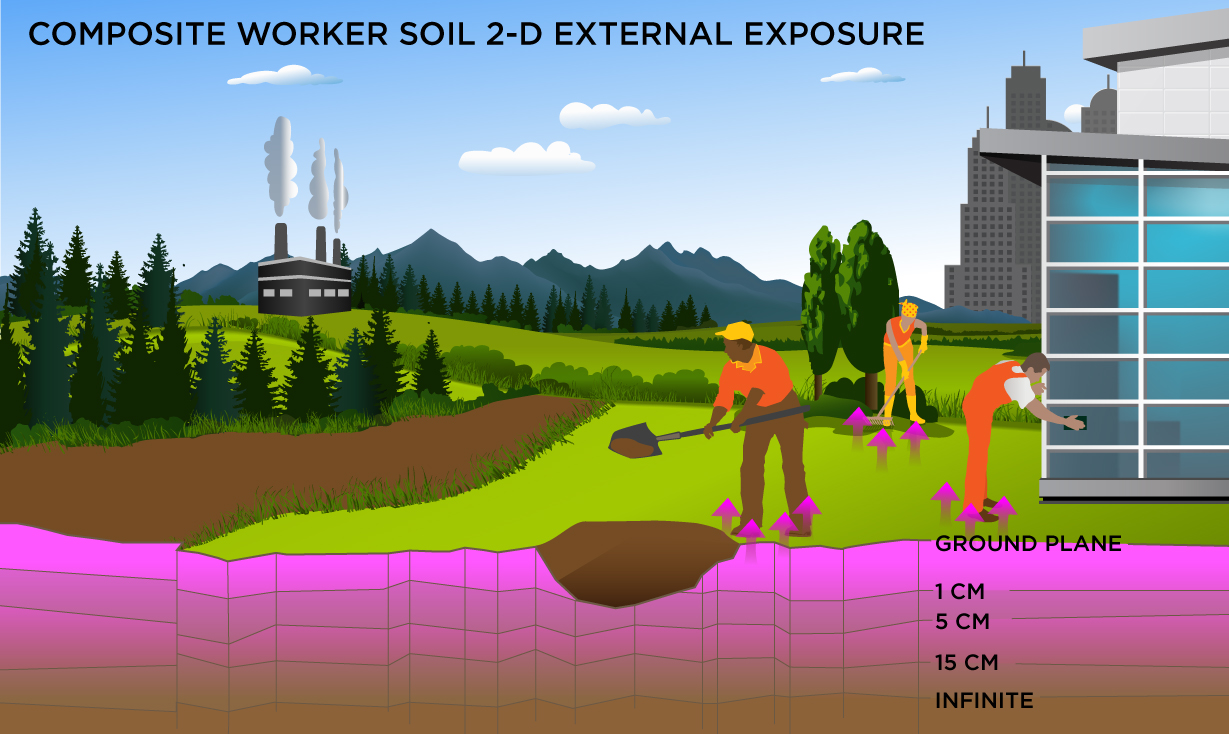
4.4.2 Composite Worker Soil Alternate External Exposure Analysis
This is a long-term receptor exposed during the work day who is a full time employee working on-site and who spends most of the workday conducting maintenance activities outdoors. The activities for this receptor (e.g., moderate digging, landscaping) typically involve on-site exposures to surface soils.
This analysis is designed to look at external exposure from contamination of different area sizes. Areas considered are 1 to 1,000,000 square meters. Isotope-specific area correction factor (ACF) were developed for this analysis.
Equations
Direct External Exposure to contamination at infinite depth

Direct External Exposure to contamination at 1 cm

Direct External Exposure to contamination at 5 cm

Direct External Exposure to contamination at 15 cm

Direct External Exposure to contamination dust

4.4.3 Composite Worker Air
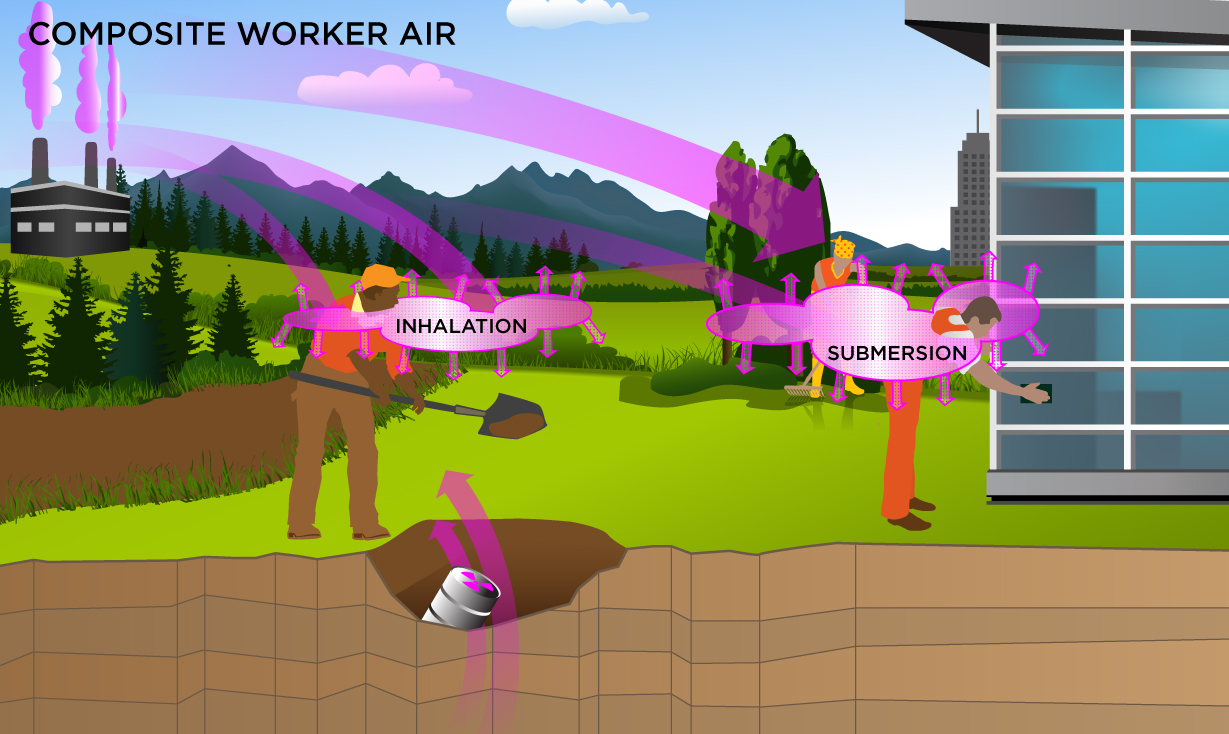
This is a long-term receptor exposed during the work day who is a full time employee working on-site and who spends most of the workday conducting maintenance activities outdoors. The activities for this receptor (e.g., moderate digging, landscaping) typically involve on-site exposures to surface soils. The composite worker is assumed to be exposed to contaminants via the following pathways: inhalation of ambient air and external radiation from contaminants in ambient air. The composite worker combines the most protective exposure assumptions of the outdoor and indoor workers. The only difference between the outdoor worker and the composite worker is that the composite worker uses the more protective exposure frequency of 250 days/year from the indoor worker scenario.
Two ambient air exposure conditions are offered for this scenario. The first scenario includes a half-life decay function and the second scenario does not. In situations where the contaminant in the air is not being replenished (e.g., an accidental one-time air release from a factory), equations for the first scenario should be used. In situations where the contaminant in the air has a continual source (e.g., indoor radon from radium in the soil, or an operating factory or landfill cap), equations for the second scenario should be used.
Equations
With Decay
The composite worker ambient air land use equations, presented here, contain the following exposure routes with half-life decay:
inhalation and

submersion.

Without Decay
The composite worker ambient air land use equation, presented here, contains the following exposure routes without half-life decay:
inhalation and

submersion.

4.5 Excavation Worker
4.5.1 Excavation Worker Soil
The excavation worker soil land use has been historically presented on the RAIS and despite the addition of the more recent construction worker scenarios in the following sections, the land use is presented for verification of previous risk assessments.
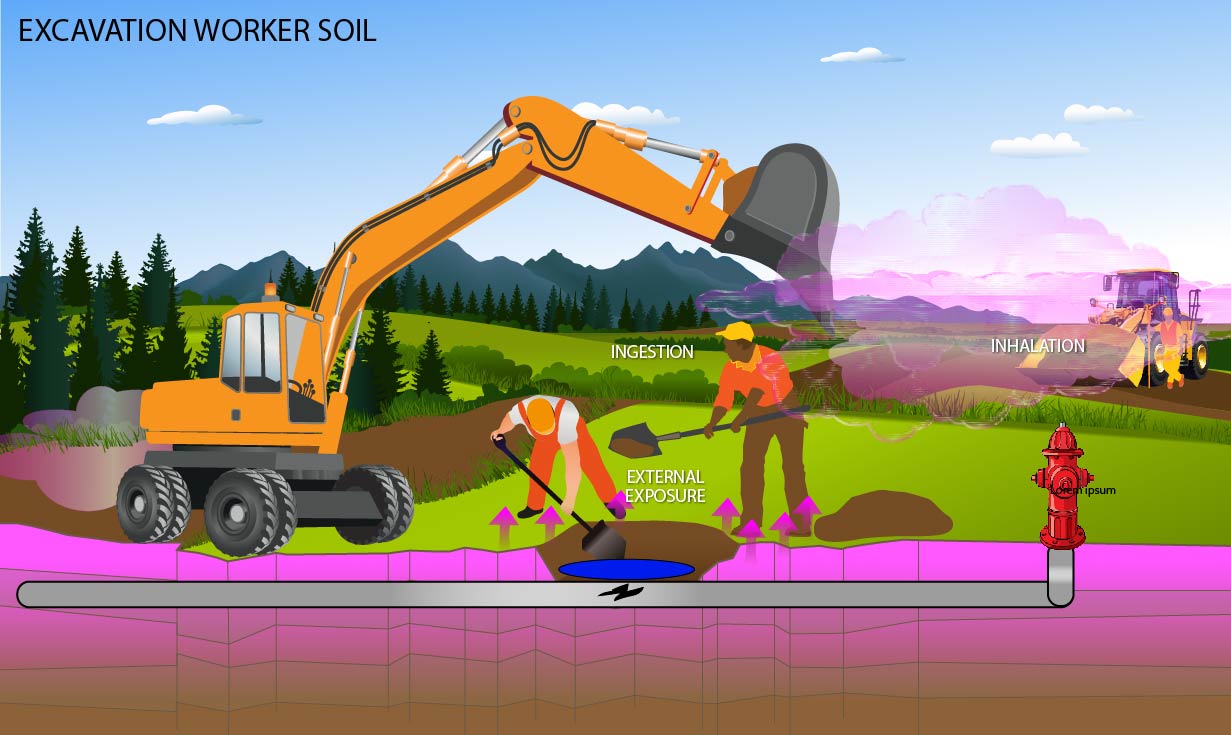
This is a short-term receptor exposed during the work day. The activities for this receptor (e.g., trenching, excavating) typically involve on-site exposures to surface soils. The excavation worker is expected to have an elevated soil ingestion rate (330 mg per day) and is assumed to be exposed to contaminants via the following pathways: incidental ingestion of soil, external radiation from contaminants in soil, inhalation of fugitive dust. The only difference between the excavation worker and the constriction worker described in section 4.6 is that the excavation worker uses a wind-driven PEF.
Equations
incidental ingestion of soil,

inhalation of particulates emitted from soil, and

external exposure to ionizing radiation.

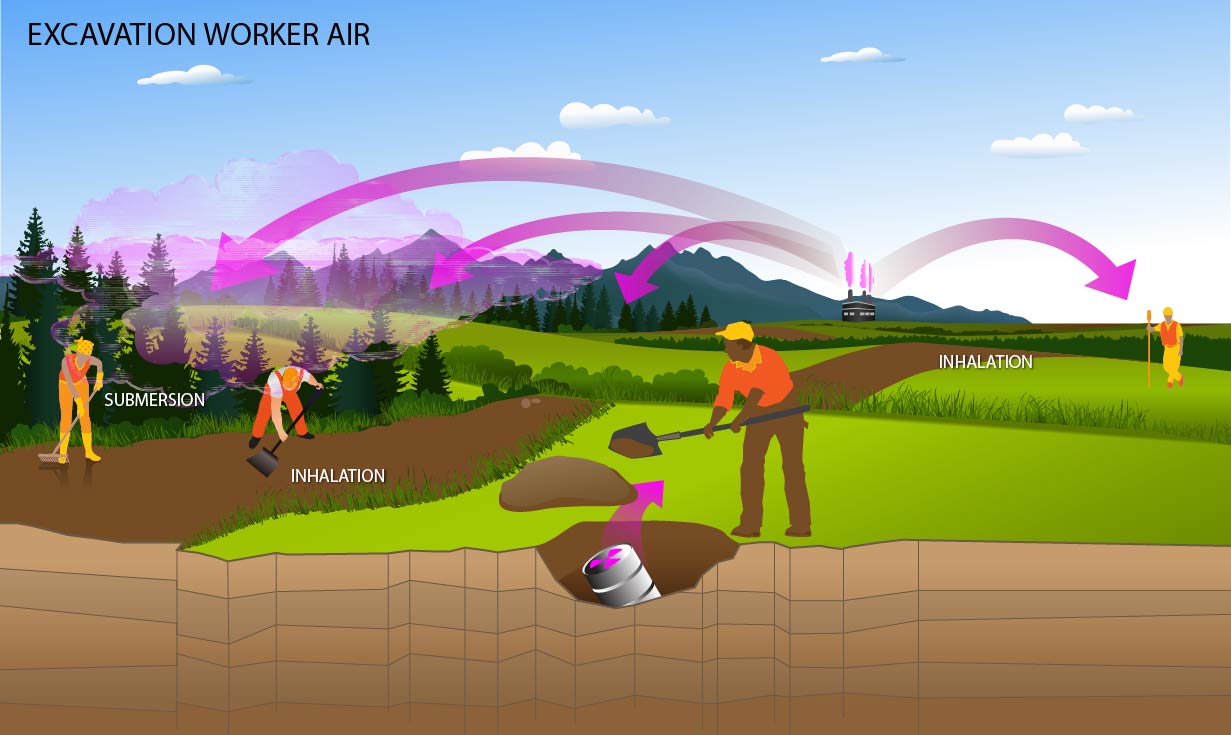
4.5.2 Excavation Worker Air
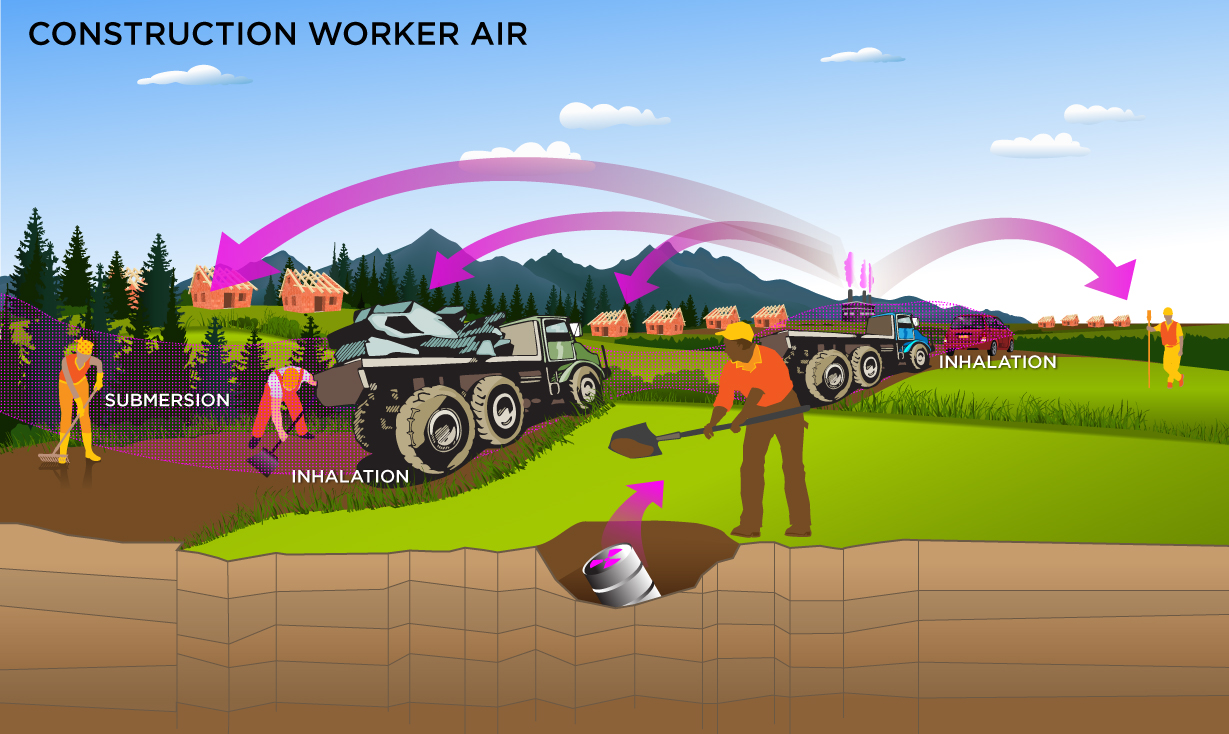
This is a short-term receptor exposed during the work day during heavy construction activities outdoors. The activities for this receptor (e.g., trenching, excavating) typically involve on-site exposures to surface soils. The construction worker is assumed to be exposed to contaminants via the following pathways: inhalation of ambient air and external radiation from contaminants in ambient air.
Two ambient air exposure conditions are offered for this scenario. The first scenario includes a half-life decay function and the second scenario does not. In situations where the contaminant in the air is not being replenished (e.g., an accidental one-time air release from a factory), equations for the first scenario should be used. In situations where the contaminant in the air has a continual source (e.g., indoor radon from radium in the soil, or an operating factory or landfill cap), equations for the second scenario should be used.
Equations
With Decay
The excavation worker ambient air land use equations, presented here, contain the following exposure routes with half-life decay:
inhalation and

external exposure to ionizing radiation

Without Decay
The composite worker ambient air land use equation, presented here, contains the following exposure routes without half-life decay:
inhalation and

external exposure to ionizing radiation

4.6 Construction Worker
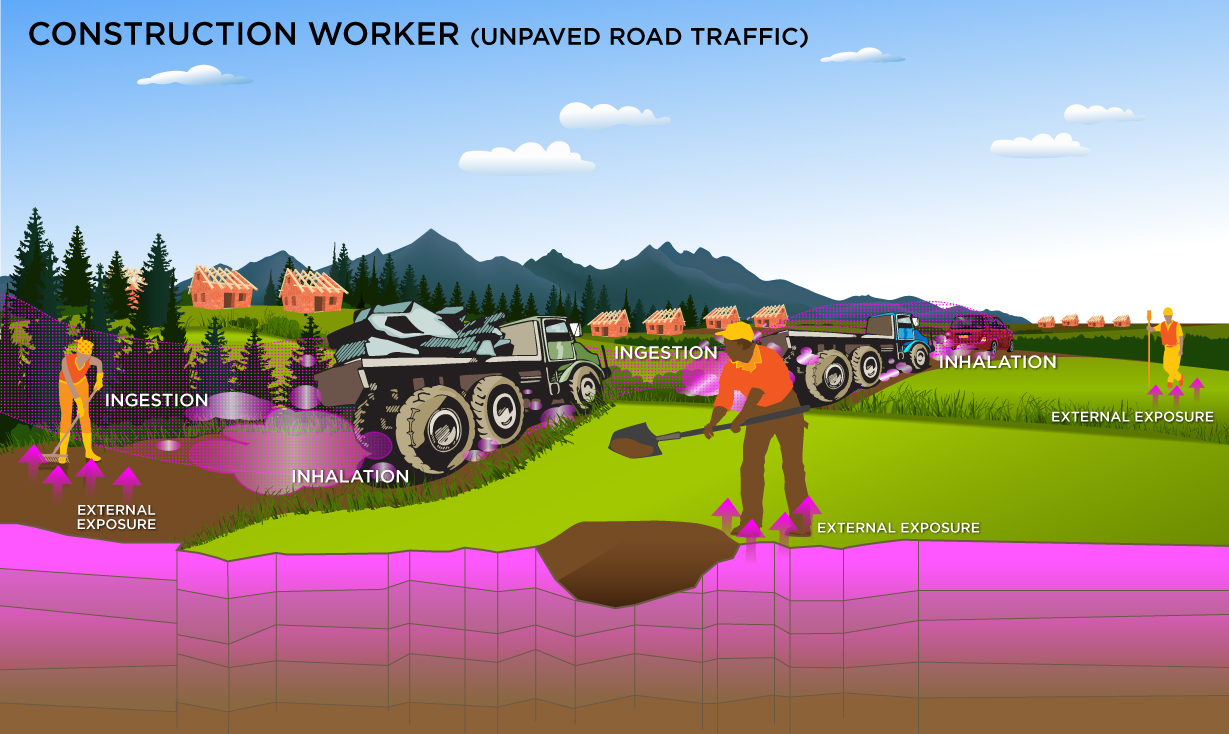
4.6.1 Construction Worker Soil exposure to Unpaved Road Traffic
This is a short-term receptor exposed during the work day working around vehicles suspending dust in the air. The activities for this receptor (e.g., trenching, excavating) typically involve on-site exposures to surface soils. The construction worker is expected to have an elevated soil ingestion rate (330 mg per day) and is assumed to be exposed to contaminants via the following pathways: incidental ingestion of soil, external radiation from contaminants in soil, inhalation of fugitive dust. The only difference between this construction worker and the one described in section 4.12 is that this construction worker uses a different PEF.
The construction worker land use is described in the supplemental soil screening guidance. This land use is limited to an exposure duration of 1 year and is thus, subchronic. Other unique aspects of this scenario are that the PEF is based on mechanical disturbance of the soil. Two types of mechanical soil disturbance are addressed: standard vehicle traffic (e.g., trenching, excavating) and other than standard vehicle traffic (e.g. wind, grading, dozing, tilling and excavating). In general, the intakes and contact rates are all greater than the outdoor worker. Exhibit 5-1 in the supplemental soil screening guidance presents the exposure parameters.
Equations
incidental ingestion of soil,

inhalation of particulates emitted from soil, and

external exposure to ionizing radiation.

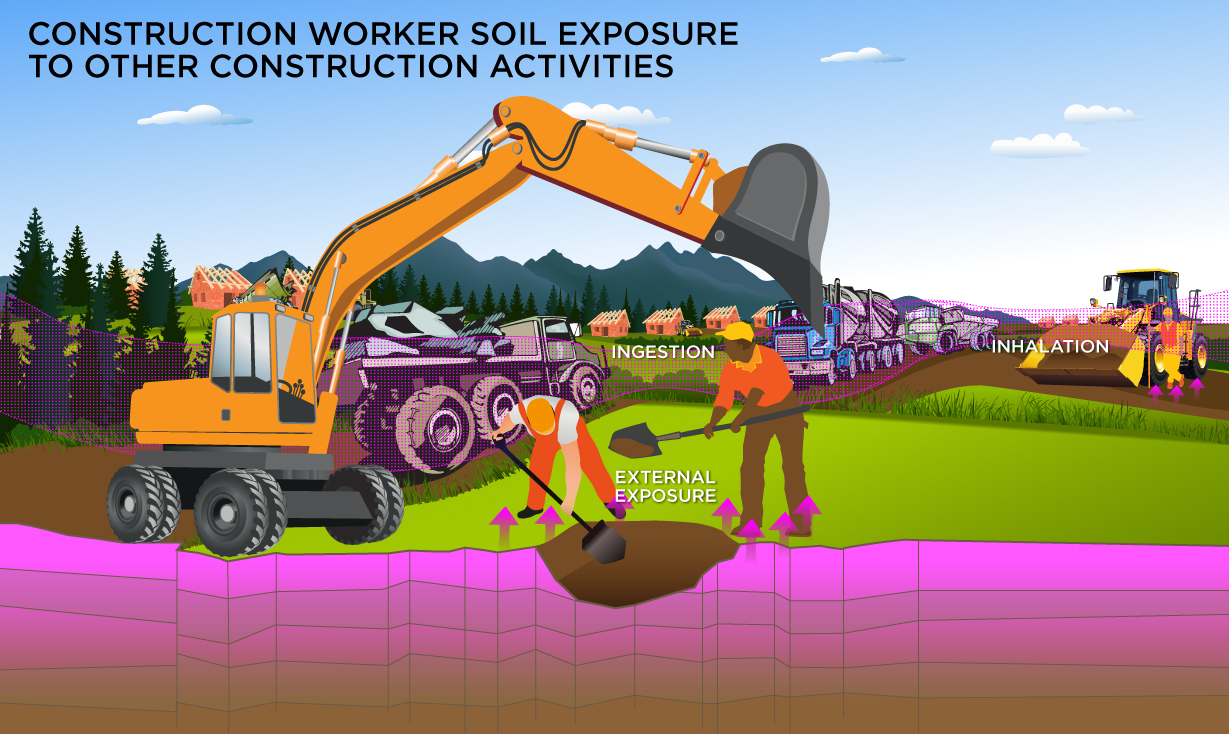
4.6.2 Construction Worker Soil Exposure to Other Than Unpaved Road Traffic
This is a short-term receptor exposed during the work day working around heavy vehicles suspending dust in the air. The activities for this receptor (e.g., dozing, grading, tilling, dumping, excavating) typically involve on-site exposures to surface soils. The construction worker is expected to have an elevated soil ingestion rate (330 mg per day) and is assumed to be exposed to contaminants via the following pathways: incidental ingestion of soil, external radiation from contaminants in soil, inhalation of fugitive dust. The only difference between this construction worker and the one described in section 4.6.1 is that this construction worker uses a different PEF.
The construction land use is described in the supplemental soil screening guidance. This land use is limited to an exposure duration of 1 year and is thus, subchronic. Other unique aspects of this scenario are that the PEF is based on mechanical disturbance of the soil. Two types of mechanical soil disturbance are addressed: standard vehicle traffic (e.g., trenching, excavating) and other than standard vehicle traffic (e.g. wind, grading, dozing, tilling and excavating). In general, the intakes and contact rates are all greater than the outdoor worker. Exhibit 5-1 in the supplemental soil screening guidance presents the exposure parameters.
Equations
The construction worker soil land use equations, presented here, contain the following exposure routes:
incidental ingestion of soil,

inhalation of particulates emitted from soil, and

external exposure to ionizing radiation

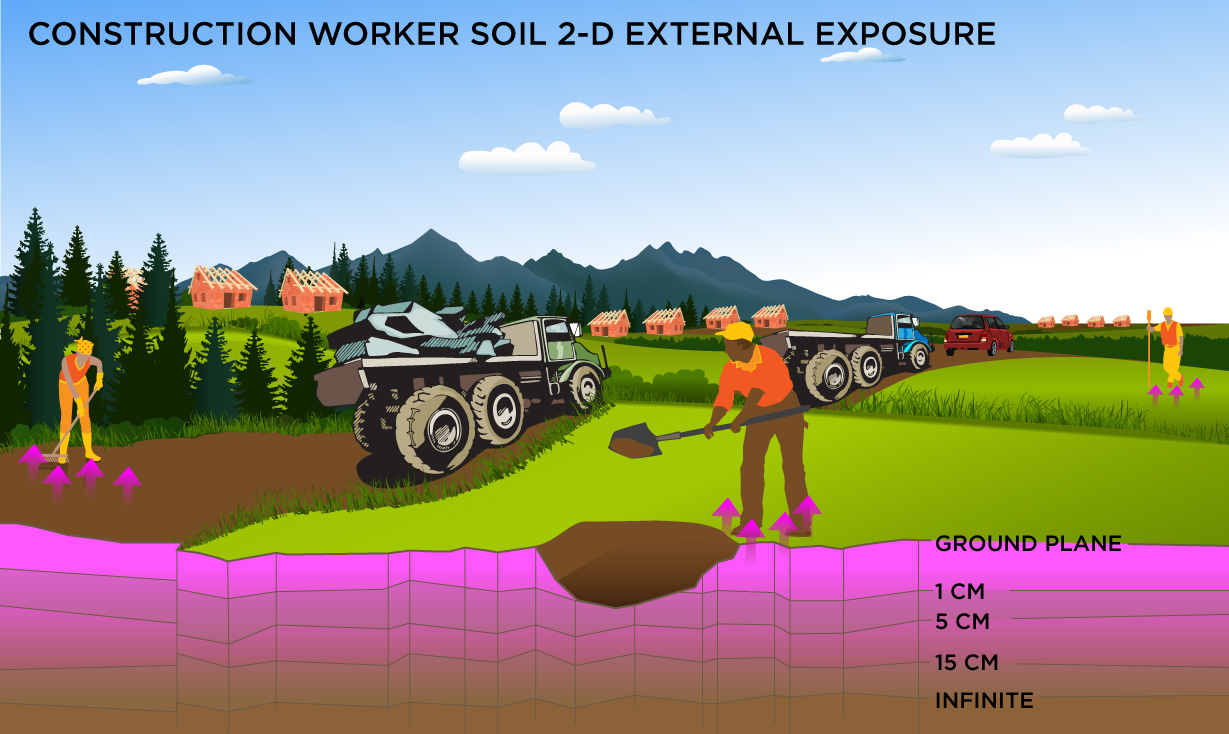
4.6.3 Construction Worker Soil Alternate External Exposure Analysis
This is a short-term receptor exposed during the work day who is a full time employee working on-site and who spends most of the workday conducting maintenance activities outdoors. The activities for this receptor (e.g., trenching, excavating, wind, grading, dozing, and tilling) typically involve on-site exposures to surface soils.
This analysis is designed to look at external exposure from contamination of different area sizes. Areas considered are 1 to 1,000,000 square meters. Isotope-specific area correction factor (ACF) were developed for this analysis.
Equations
Direct External Exposure to contamination at infinite depth

Direct External Exposure to contamination at 1 cm

Direct External Exposure to contamination at 5 cm

Direct External Exposure to contamination at 15 cm

Direct External Exposure to contamination dust

4.6.4 Construction Worker Air
This is a short-term receptor exposed during the work day during heavy construction activities outdoors. The activities for this receptor (e.g., trenching, excavating, wind, grading, dozing, and tilling) typically involve on-site exposures to surface soils. The construction worker is assumed to be exposed to contaminants via the following pathways: inhalation of ambient air and external radiation from contaminants in ambient air.
Two ambient air exposure conditions are offered for this scenario. The first scenario includes a half-life decay function and the second scenario does not. In situations where the contaminant in the air is not being replenished (e.g., an accidental one-time air release from a factory), equations for the first scenario should be used. In situations where the contaminant in the air has a continual source (e.g., indoor radon from radium in the soil, or an operating factory or landfill cap), equations for the second scenario should be used.
Equations
With Decay
The construction worker ambient air land use equations, presented here, contain the following exposure routes with half-life decay:
inhalation and 
submersion. 
Without Decay
The composite worker ambient air land use equation, presented here, contains the following exposure routes without half-life decay:
inhalation and 
submersion. 
4.7 Recreator
4.7.1 Recreator Soil
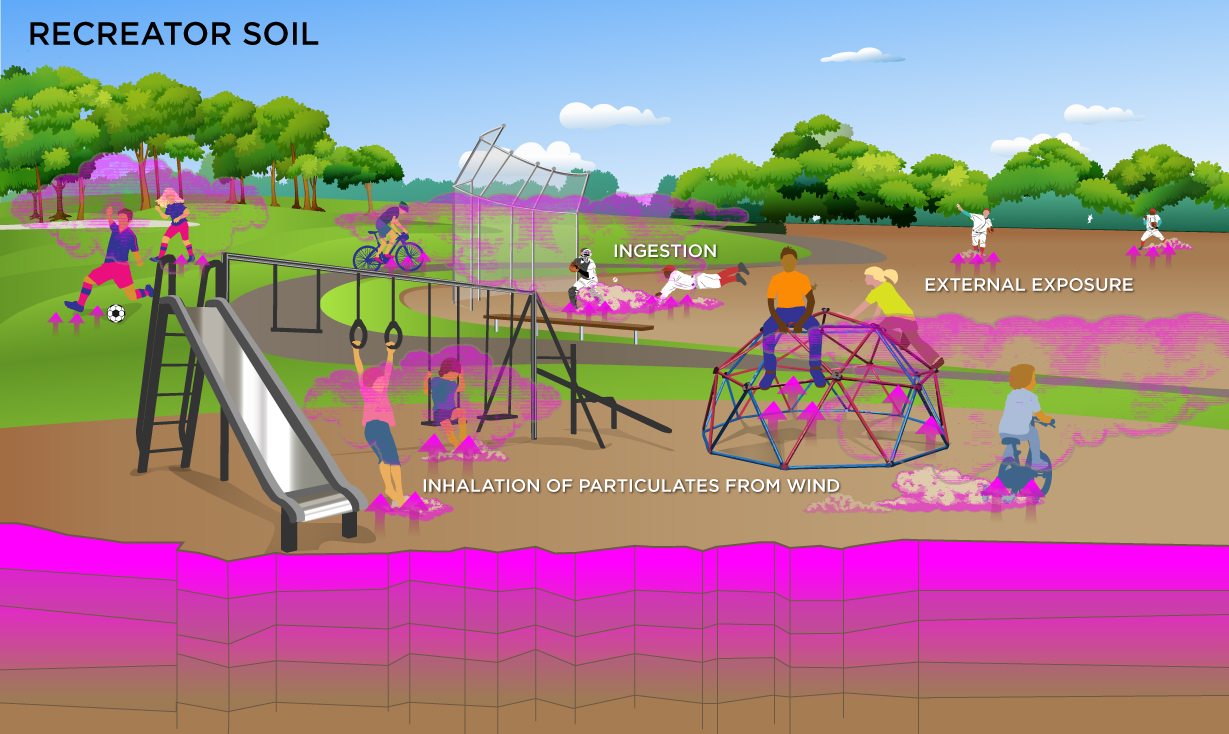
This receptor spends time outside involved in recreational activities. The recreator is assumed to be exposed to contaminants via the following pathways: incidental ingestion of soil, external exposure, and inhalation of fugitive dust. The exposure time and frequency are reasonable estimates based on weekend activities during the warmest 9 months of the year equating to about 75 days per year.
Equations
The recreational soil land use equations, presented here, contain the following exposure routes:
incidental ingestion of soil, 
inhalation of particulates emitted from soil, and 
external exposure to ionizing radiation. 
consumption of fowl - back-calculated to soil 
consumption of game - back-calculated to soil 
4.7.2 Recreator Soil Alternate External Exposure Analysis
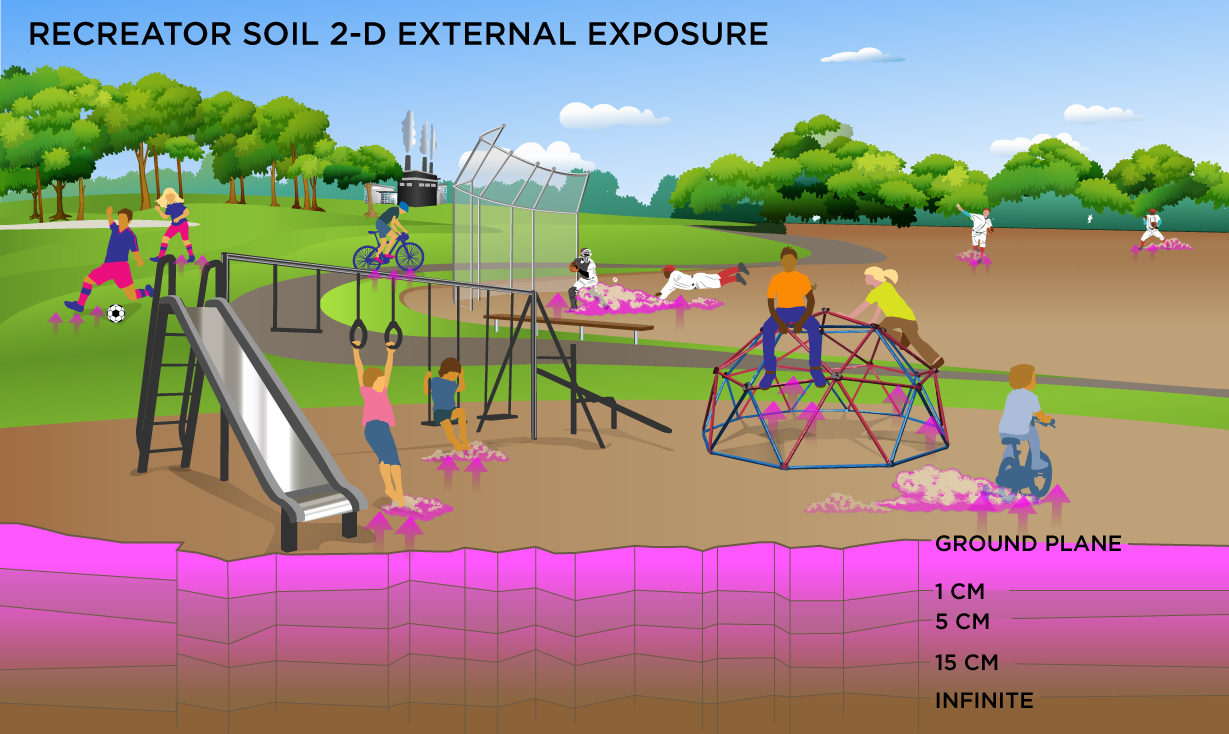
This receptor spends time outside involved in recreational activities.
This analysis is designed to look at external exposure from contamination of different area sizes. Areas considered are 1 to 1,000,000 square meters. Isotope-specific area correction factors (ACF) were developed for this analysis.
Equations
Direct External Exposure to contamination at infinite depth

Direct External Exposure to contamination at 1 cm

Direct External Exposure to contamination at 5 cm

Direct External Exposure to contamination at 15 cm

Direct External Exposure to contamination dust

4.7.3 Recreator Air
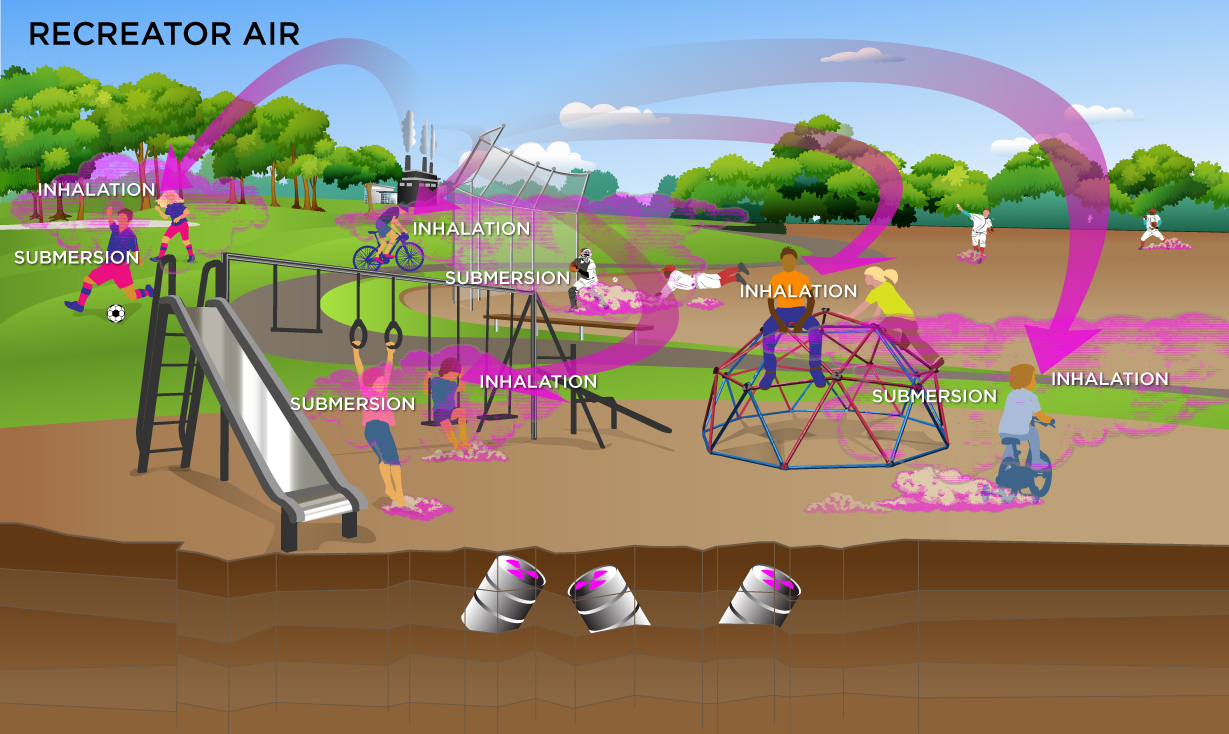
This receptor spends time involved in recreational activities.
Two ambient air exposure conditions are offered for this scenario. The first scenario includes a half-life decay function and the second scenario does not. In situations where the contaminant in the air is not being replenished (e.g., an accidental one-time air release from a factory), equations for the first scenario should be used. In situations where the contaminant in the air has a continual source (e.g., indoor radon from radium in the soil, or an operating factory or landfill cap), equations for the second scenario should be used.
Equations
With Decay
The recreator ambient air land use equation, presented here, contains the following exposure routes with half-life decay:
inhalation and

submersion.

Without Decay
The recreator ambient air land use equation, presented here, contains the following exposure routes without half-life decay:
inhalation and

submersion.

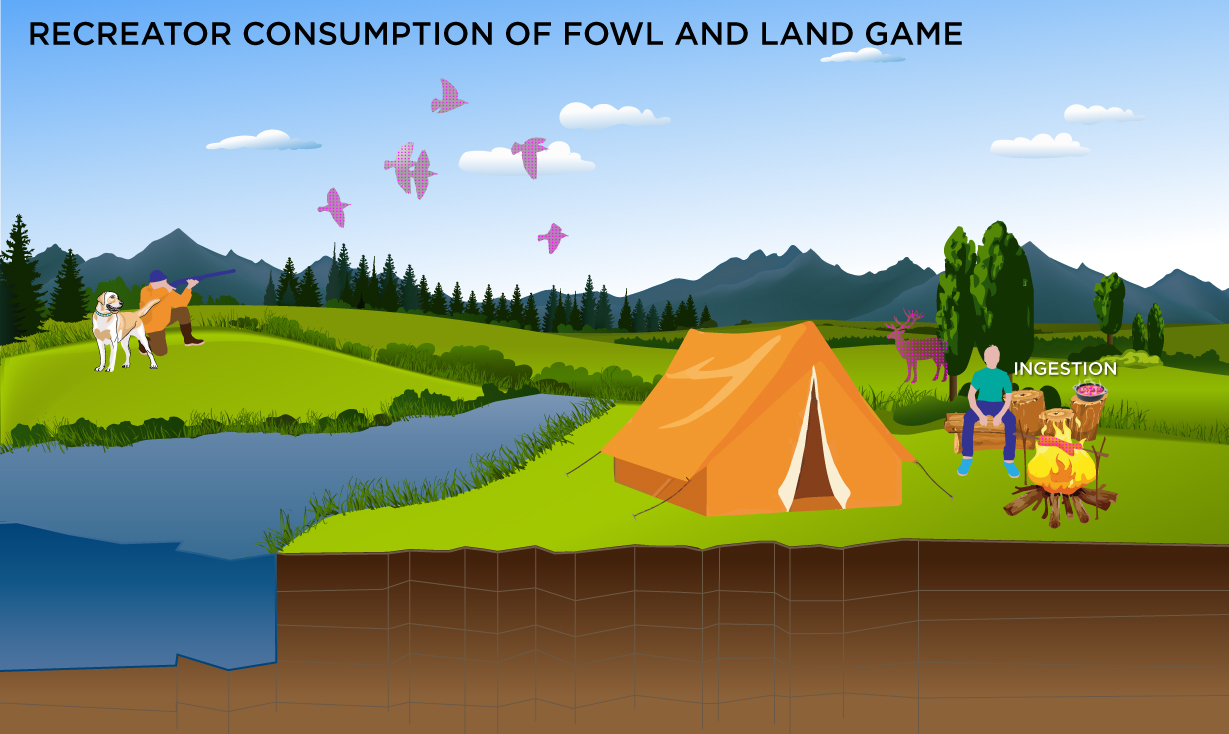
4.7.4 Recreator Consumption of Fowl and Game
This receptor spends time involved in recreational hunting of waterfowl and land game.
Equations
The consumption of fowl and game equations, presented here, contain the following exposure routes:
consumption of fowl - direct

consumption of land game - direct

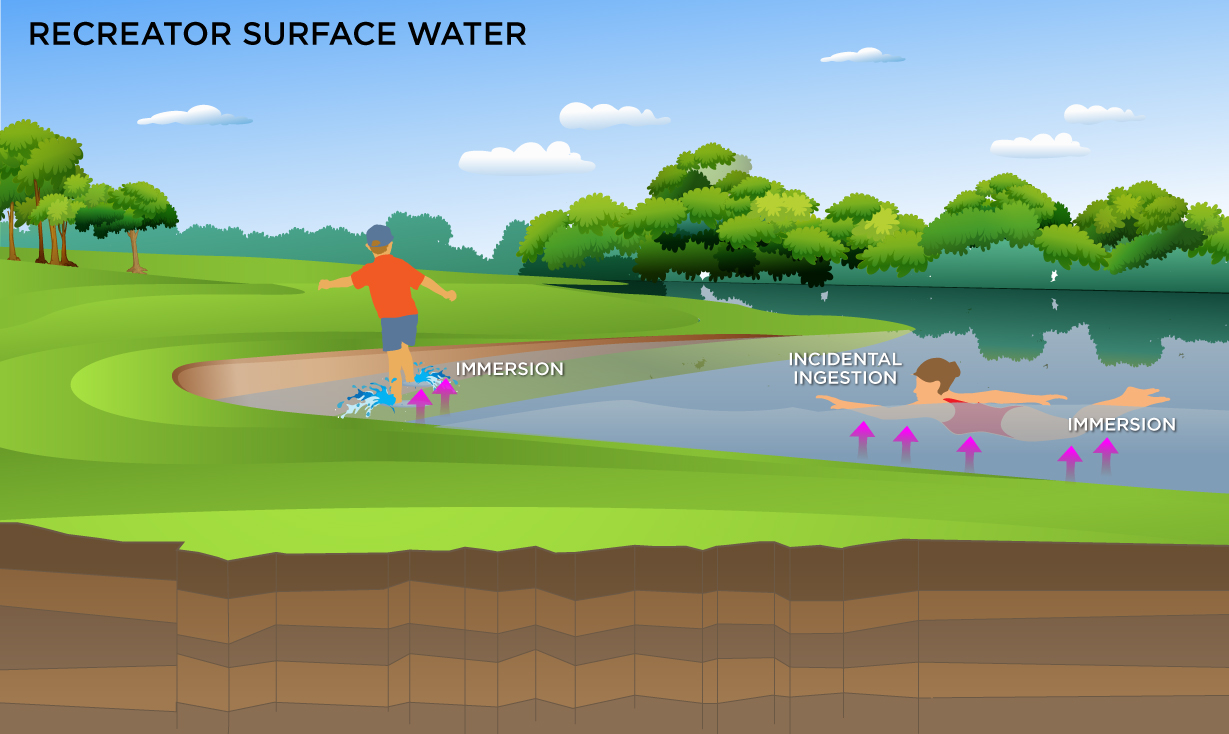
4.7.5 Recreator Surface Water
This receptor is exposed to radionuclides that are present in surface water. Ingestion of water and immersion in water are appropriate pathways for all radionuclides. Inhalation is not considered due to mixing with outdoor air. The exposure time and events per day are reasonable estimates.
Equations
The surface water land use equation, presented here, contains the following exposure route:
ingestion of surface water.

immersion in surface water.

consumption of fowl - back-calculated to water

consumption of game - back-calculated to water

4.8 Farmer
4.8.1 Farmer Direct Consumption of Agricultural Products
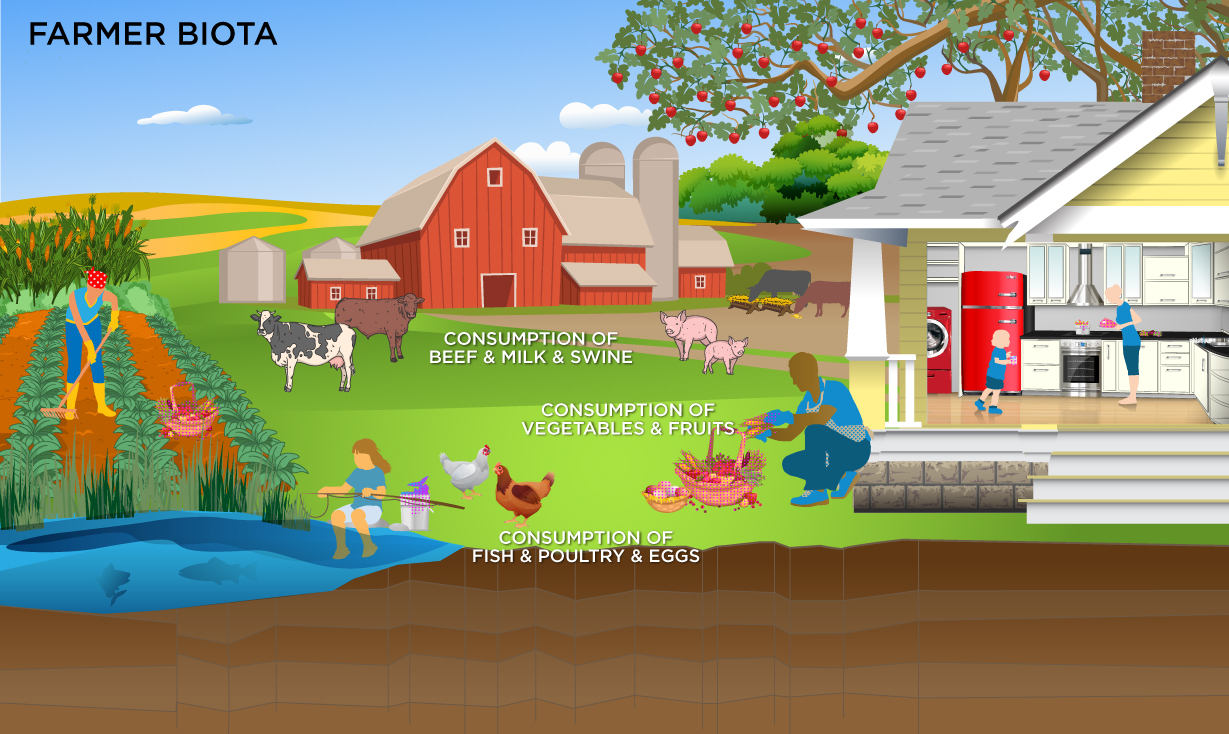
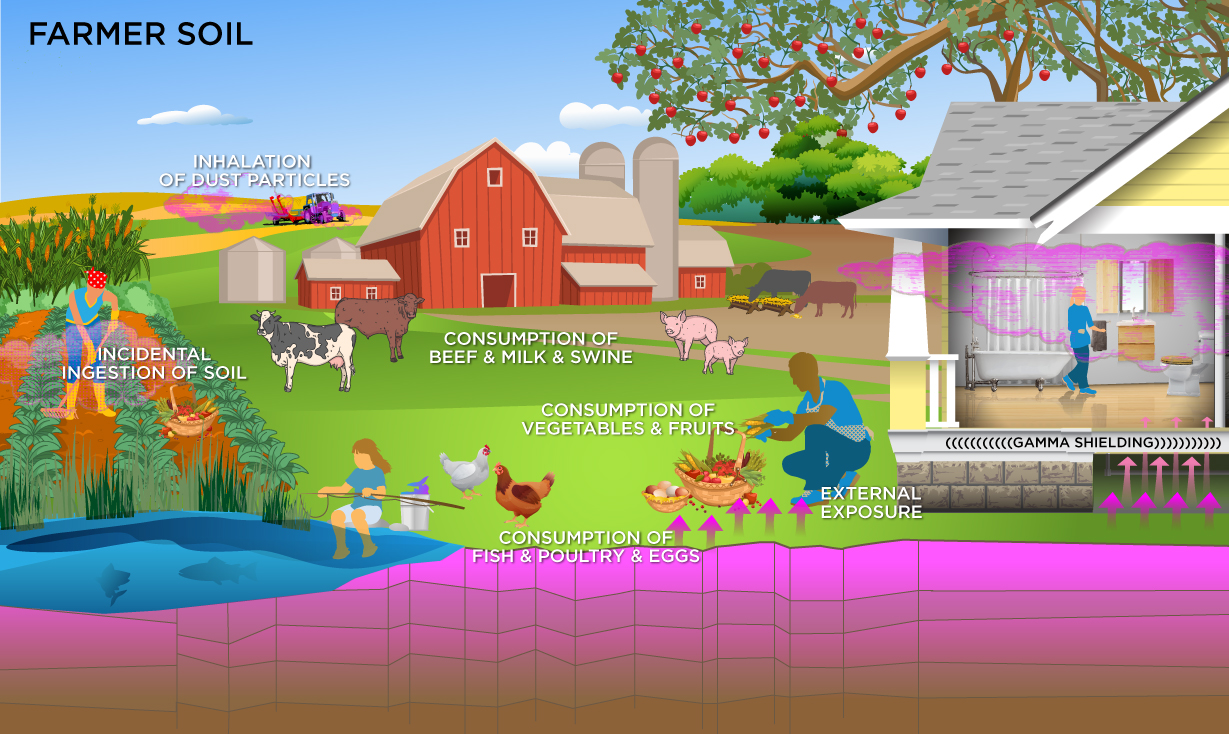
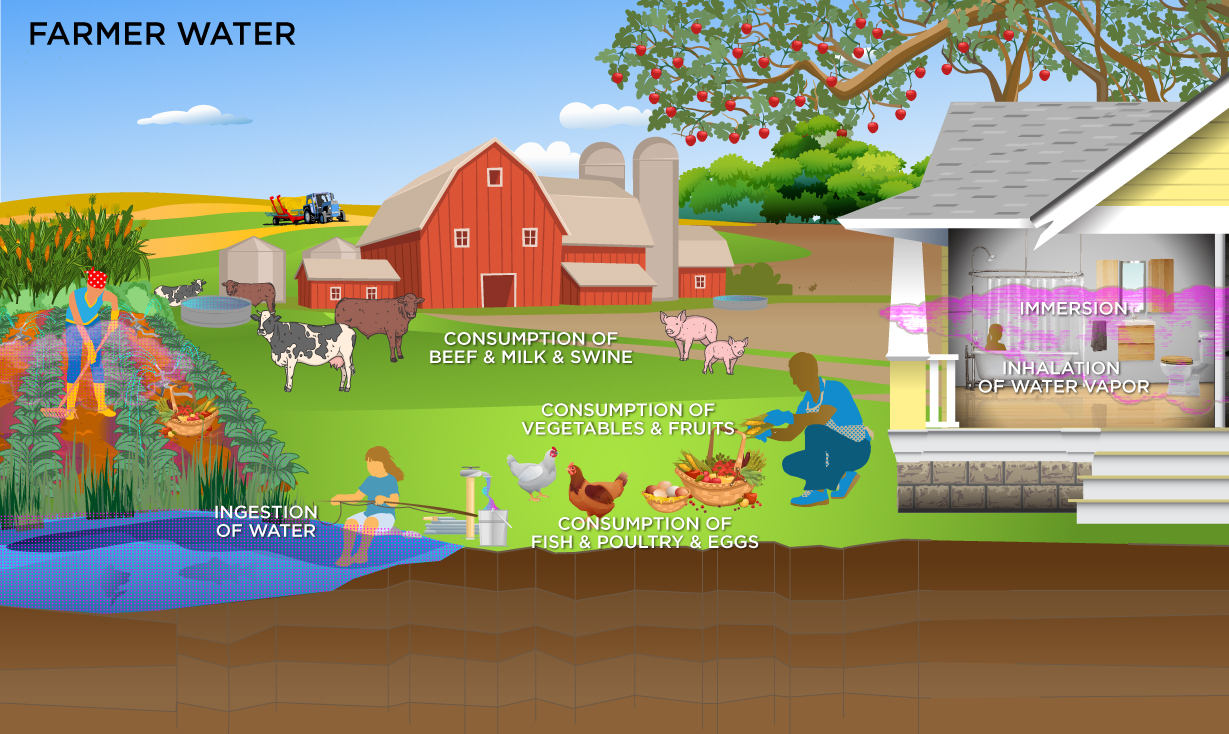
The farmer scenario should be considered an extension of the resident scenario and evaluate consumption of farm products for a subsistence farmer. Like the resident, the farmer assumes the receptor will be exposed via the consumption of home grown produce (100% of fruit and vegetables are from the farm). In addition to produce, 100% of consumption of the following are also considered to be from the farm: beef, milk, fish, swine, egg and poultry. All feed (100%) for farm products is considered to have been grown on contaminated portions of the site. For these farm products, risks are provided for the farm product itself (produce, beef, milk, etc.). Also like the resident, age-adjusted intake equations were developed for all of the consumption equations to account for changes in intake as the receptor ages.
Graphical Representation
Agricultural Biota, Soil and Water Graphic and Supporting Text
Equations
consumption of produce. The exposed and root vegetable consumption rates were combined to represent total vegetable consumption. Where no intake rate was given for an age group, the mean value was substituted and the intake rate from the 6 to 11 age group was assumed to be the same for ages 7 to 11.

consumption of poultry. Intake rates from the Exposure Factors Handbook were averaged over age groups to determine adult and child intake rates. Where no intake rate was given for an age group, the mean value was substituted and the intake rate from the 6 to 11 age group was assumed to be the same for ages 7 to 11. There was no adjustment for preparation or cooking loss U.S. EPA 1998.

consumption of eggs. Intake rates from the Exposure Factors Handbook were averaged over age groups to determine adult and child intake rates. Where no intake rate was given for an age group, the mean value was substituted and the intake rate from the 6 to 11 age group was assumed to be the same for ages 7 to 11. There was no adjustment for preparation or cooking loss U.S. EPA 1998.

consumption of beef. Intake rates from the Exposure Factors Handbook were averaged over age groups to determine adult and child intake rates. Where no intake rate was given for an age group, the mean value was substituted and the intake rate from the 6 to 11 age group was assumed to be the same for ages 7 to 11. There was no adjustment for preparation or cooking loss U.S. EPA 1998.

consumption of milk. Intake rates from the Exposure Factors Handbook were averaged over age groups to determine adult and child intake rates. Where no intake rate was given for an age group, the mean value was substituted and the intake rate from the 6 to 11 age group was assumed to be the same for ages 7 to 11. No adjustment for losses U.S. EPA 1998. Home produced dairy total was converted to fluid milk by a factor of 82% (82% of total dairy consumed is fluid milk. )

consumption of swine. Intake rates from the Exposure Factors Handbook were averaged over age groups to determine adult and child intake rates. Where no intake rate was given for an age group, the mean value was substituted and the intake rate from the 6 to 11 age group was assumed to be the same for ages 7 to 11. There was no adjustment for preparation or cooking loss U.S. EPA 1998.

consumption of fish. Intake rates from the Exposure Factors Handbook were averaged over age groups to determine adult and child intake rates. Where no intake rate was given for an age group, the mean value was substituted and the intake rate from the 6 to 11 age group was assumed to be the same for ages 7 to 11. There was no adjustment for preparation or cooking loss as was done in U.S. EPA 1998.

4.8.2 Farmer Direct Exposure and Consumption of Agricultural Products - Back Calculated to Soil
The farmer scenario should be considered an extension of the resident scenario and evaluate consumption of farm products for a subsistence farmer. Like the resident, the farmer scenario assumes the receptor will be exposed via the following pathways: incidental ingestion of soil, external radiation from contaminants in soil, inhalation of fugitive dust and consumption of home grown produce (100% of fruit and vegetables are from the farm). In addition to produce, 100% of consumption of the following are also considered to be from the farm: beef, milk, fish, swine, egg and poultry. All feed (100%) for farm products is considered to have been grown on contaminated portions of the site. For these farm products, risks are provided for soil which may contribute contaminants to the products. Also like the resident, age-adjusted intake equations were developed for all of the ingestion/consumption equations to account for changes in intake as the receptor ages.
Equations
incidental ingestion of soil,

inhalation of particulates emitted from soil,

external exposure to ionizing radiation, and

consumption of produce. The exposed and root vegetable consumption rates were combined to represent total vegetable consumption. Where no intake rate was given for an age group, the mean value was substituted and the intake rate from the 6 to 11 age group was assumed to be the same for ages 7 to 11.

consumption of eggs. Intake rates from the Exposure Factors Handbook were averaged over age groups to determine adult and child intake rates. Where no intake rate was given for an age group, the mean value was substituted and the intake rate from the 6 to 11 age group was assumed to be the same for ages 7 to 11. There was no adjustment for preparation or cooking loss U.S. EPA 1998.

consumption of poultry. Intake rates from the Exposure Factors Handbook were averaged over age groups to determine adult and child intake rates. Where no intake rate was given for an age group, the mean value was substituted and the intake rate from the 6 to 11 age group was assumed to be the same for ages 7 to 11. There was no adjustment for preparation or cooking loss U.S. EPA 1998.
consumption of fish. Intake rates from the Exposure Factors Handbook were averaged over age groups to determine adult and child intake rates. Where no intake rate was given for an age group, the mean value was substituted and the intake rate from the 6 to 11 age group was assumed to be the same for ages 7 to 11. There was no adjustment for preparation or cooking loss as was done in U.S. EPA 1998.

consumption of beef. Intake rates from the Exposure Factors Handbook were averaged over age groups to determine adult and child intake rates. Where no intake rate was given for an age group, the mean value was substituted and the intake rate from the 6 to 11 age group was assumed to be the same for ages 7 to 11. There was no adjustment for preparation or cooking loss U.S. EPA 1998.

consumption of milk. Intake rates from the Exposure Factors Handbook were averaged over age groups to determine adult and child intake rates. Where no intake rate was given for an age group, the mean value was substituted and the intake rate from the 6 to 11 age group was assumed to be the same for ages 7 to 11. No adjustment for losses U.S. EPA 1998. Home produced dairy total was converted to fluid milk by a factor of 82% (82% of total dairy consumed is fluid milk. )

consumption of swine. Intake rates from the Exposure Factors Handbook were averaged over age groups to determine adult and child intake rates. Where no intake rate was given for an age group, the mean value was substituted and the intake rate from the 6 to 11 age group was assumed to be the same for ages 7 to 11. There was no adjustment for preparation or cooking loss U.S. EPA 1998.

4.8.3 Farmer Direct Exposure and Consumption of Agricultural Products - Back Calculated to Water
The farmer scenario should be considered an extension of the resident scenario and evaluate consumption of farm products for a subsistence farmer. Like the resident, the farmer scenario assumes the receptor will be exposed via the following pathways: ingestion of tap water, external radiation from contaminants in tap water, inhalation of gases in tap water and consumption of home grown produce (100% of fruit and vegetables are from the farm). The inhalation exposure route is only calculated for C-14, H-3, Rn-220, and Rn-222 which volatilize. The submersion route is also included for radioactive gases in tap water. This addition was based on research found in ORNL/TM-2023/3001 - Quantifying the Impact of the Exclusion of the Submersion Exposure Route in Soil and Tap Water Models in Existing Superfund Radionuclide Screening Level Calculators. In addition to produce, 100% of consumption of the following are also considered to be from the farm: beef, milk, fish, swine, egg and poultry. All water (100%) for farm products is considered to have been provided from contaminated portions of the site. For these farm products, risks are provided for the water which may contribute contaminants to the products. Also like the resident, age-adjusted intake equations were developed for all of the ingestion/consumption equations to account for changes in intake as the receptor ages.
Equations
ingestion of tap water,

inhalation, (The inhalation exposure route is only calculated for C-14, H-3, Rn-220, Rn-222, and Rn-222+D). Also, volatilization in the equation comes from household uses of water (e.g., showering, laundering, dish washing)

submersion, (The submersion exposure route is only calculated for C-14, H-3, Rn-220, Rn-222, and Rn-222+D). Also, volatilization in the equation comes from household uses of water (e.g., showering, laundering, dish washing)

immersion in water

consumption of produce. The exposed and root vegetable consumption rates were combined to represent total vegetable consumption. Where no intake rate was given for an age group, the mean value was substituted and the intake rate from the 6 to 11 age group was assumed to be the same for ages 7 to 11.

consumption of eggs. Intake rates from the Exposure Factors Handbook were averaged over age groups to determine adult and child intake rates. Where no intake rate was given for an age group, the mean value was substituted and the intake rate from the 6 to 11 age group was assumed to be the same for ages 7 to 11. There was no adjustment for preparation or cooking loss U.S. EPA 1998.

consumption of poultry. Intake rates from the Exposure Factors Handbook were averaged over age groups to determine adult and child intake rates. Where no intake rate was given for an age group, the mean value was substituted and the intake rate from the 6 to 11 age group was assumed to be the same for ages 7 to 11. There was no adjustment for preparation or cooking loss U.S. EPA 1998.

consumption of fish. Intake rates from the Exposure Factors Handbook were averaged over age groups to determine adult and child intake rates. Where no intake rate was given for an age group, the mean value was substituted and the intake rate from the 6 to 11 age group was assumed to be the same for ages 7 to 11. There was no adjustment for preparation or cooking loss as was done in U.S. EPA 1998.

consumption of beef. Intake rates from the Exposure Factors Handbook were averaged over age groups to determine adult and child intake rates. Where no intake rate was given for an age group, the mean value was substituted and the intake rate from the 6 to 11 age group was assumed to be the same for ages 7 to 11. There was no adjustment for preparation or cooking loss U.S. EPA 1998.

consumption of milk. Intake rates from the Exposure Factors Handbook were averaged over age groups to determine adult and child intake rates. Where no intake rate was given for an age group, the mean value was substituted and the intake rate from the 6 to 11 age group was assumed to be the same for ages 7 to 11. No adjustment for losses U.S. EPA 1998. Home produced dairy total was converted to fluid milk by a factor of 82% (82% of total dairy consumed is fluid milk. )

consumption of swine. Intake rates from the Exposure Factors Handbook were averaged over age groups to determine adult and child intake rates. Where no intake rate was given for an age group, the mean value was substituted and the intake rate from the 6 to 11 age group was assumed to be the same for ages 7 to 11. There was no adjustment for preparation or cooking loss U.S. EPA 1998.

4.9 Soil to Groundwater
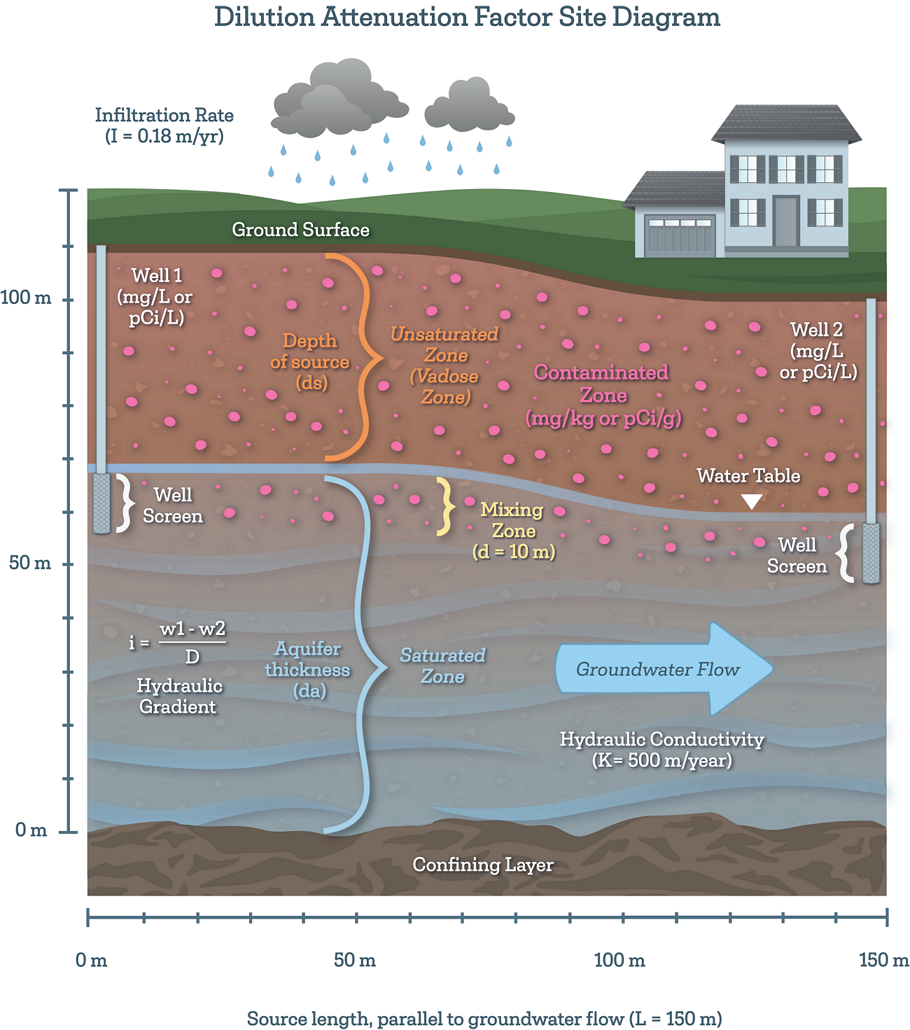
The soil migration to groundwater risk scenario is used to determine risk from groundwater exposure based on concentration in soil. Migration of contaminants from soil to groundwater can be envisioned as a two-stage process: (1) release of contaminant from soil to soil leachate and (2) transport of the contaminant through the underlying soil and aquifer to a receptor well. The soil to groundwater scenario considers both of these fate and transport mechanisms. The groundwater concentration is determined using a known concentration in soil, radionuclide specific Kd, and a dilution attenuation factor to obtain a risk. The soil to groundwater media option is included in both resident and indoor worker land use scenarios as they both model tap water risk.
Equations
The user has the option to choose from two calculation methods. The first method employs the default partitioning equation for migration to groundwater. The dilution attenuation factor defaults to 20 for a 0.5-acre source. If the user has all of the parameters needed to calculate a dilution attenuation factor, you may use the Method 2 (mass-limit equation for migration to groundwater). The groundwater concentration, determined with either of these equations, is used to calculate the tap water chronic daily intake equations presented in secion 4.1.4.
Method 1. Partitioning Equation for Migration to Groundwater

Method 2. Mass-Limit Equation for Migration to Groundwater

4.9.1 Determination of the Dilution Attenuation Factor
The default risk/hazard values are based on a dilution attenuation factor of 1. If one wishes to use the calculator to calculate risks or hazards using the SSL guidance for a source up to 0.5 acres, then a dilution attenuation factor of 20 can be used. If all of the parameters needed to calculate a site-specific dilution attenuation factor are known, they may be entered.
dilution attenuation factor.
4.10 Supporting Equations and Parameter Discussion
There are three parts of the above land use equations that require further explanation. The first is explanation of two inhalation variables: the particulate emission factor (PEF) and the volatilization factor (VF). The second is the use of the radionuclide decay constant (λ). The third is the explanation of the area correction factor (ACF).
4.10.1 Particulate Emission Factor (PEF) and Volatilization Factor (VF)
Inhalation of isotopes adsorbed to respirable particles (PM10) was assessed using a default PEF equal to 1.36 x 10⁹ m3/kg. This equation relates the contaminant concentration in soil with the concentration of respirable particles in the air due to fugitive dust emissions from contaminated soils. The generic PEF was derived using default values that correspond to a receptor point concentration of approximately 0.76 µg/m3. The relationship is derived by Cowherd (1985) for a rapid assessment procedure applicable to a typical hazardous waste site, where the surface contamination provides a relatively continuous and constant potential for emission over an extended period of time (e.g. years). This represents an annual average emission rate based on wind erosion that should be compared with chronic health criteria; it is not appropriate for evaluating the potential for more acute exposures. Definitions of the input variables are in Section 5.
With the exception of specific heavy metals, the PEF does not appear to significantly affect most soil screening levels. The equation forms the basis for deriving a generic PEF for the inhalation pathway. For more details regarding specific parameters used in the PEF model, refer to Soil Screening Guidance: Technical Background Document. The use of alternate values on a specific site should be justified and presented in an Administrative Record if considered in CERCLA remedy selection.

Note: the generic PEF evaluates wind-borne emissions and does not consider dust emissions from traffic or other forms of mechanical disturbance that could lead to greater emissions than assumed here.
EPA derived a default volatilization factor (VF) value of 17 m3/kg for tritium. The VF replaces the PEF in the risk equations when tritium is being addressed. This VF value is based on a steady-state model that assumes, on average, tritium in soil pore water and tritium in air (as tritiated water vapor) will be distributed in the environment in proportion to the average water content in soil and air. EPA assumes a mean atmospheric humidity of 6 grams of water per cubic meter of air (g/m3) nationwide (Etnier 1980) and an average soil moisture content of 10% (i.e., 100 grams of water per kilogram of soil). Given these assumptions, EPA calculates the VF term for tritium as
VFH-3 = 100 g H2O/kg soil ÷ 6 g H2O/m3 air
= 17 m3 air/kg soil
= 17 m3/kg
EPA believes that this value is appropriate for the average case, both outdoors and indoors. However, site managers can derive a site-specific VF term for tritium that may be more appropriate for a specific site, considering local atmospheric humidity and soil moisture content.
4.10.2 Unpaved Road Vehicle Traffic Particulate Emission Factor (PEFsc)
The equation to calculate the subchronic particulate emission factor (PEFsc) is significantly different from the residential and non-residential PEF equations. The PEFsc focuses exclusively on emissions from truck traffic on unpaved roads, which typically contribute the majority of dust emissions during construction. This equation requires estimates of parameters such as the number of days with at least 0.01 inches of rainfall, the mean vehicle weight, and the sum of fleet vehicle distance traveled during construction.
The number of days with at least 0.01 inches of rainfall can be estimated using Exhibit 5-2 in the supplemental soil screening guidance. Mean vehicle weight (W) can be estimated by assuming the numbers and weights of different types of vehicles. For example, assuming that the daily unpaved road traffic consists of 20 two-ton cars and 10 twenty-ton trucks, the mean vehicle weight would be:
W = [(20 cars x 2 tons/car) + (10 trucks x 20 tons/truck)]/30 vehicles = 8 tons
The sum of the fleet vehicle kilometers traveled during construction (∑ VKT) can be estimated based on the size of the area of surface soil contamination, assuming the configuration of the unpaved road, and the amount of vehicle traffic on the road. For example, if the area of surface soil contamination is 0.5 acres (or 2,024 m2) and one assumes that this area is configured as a square with the unpaved road segment dividing the square evenly, the road length would be equal to the square root of 2,024 m2, 45 m (or 0.045 km). Assuming that each vehicle travels the length of the road once per day, 5 days per week for a total of 6 months, the total fleet vehicle kilometers traveled would be:
∑ VKT = 30 vehicles x 0.045 km/day x (52 wks/yr / 2) x 5 days/wk = 175.5 km

4.10.3 Other Than Unpaved Road Vehicle Traffic Particulate Emission Factor (PEF'sc)
Other than emissions from unpaved road traffic, the construction worker may also be exposed to particulate matter emissions from wind erosion, excavation soil dumping, dozing, grading, and tilling or similar operations PEF'sc. These operations may occur separately or concurrently and the duration of each operation may be different. For these reasons, the total unit mass emitted from each operation is calculated separately and the sum is normalized over the entire area of contamination and over the entire time during which construction activities take place. Equation E-26 in the supplemental soil screening guidance was used.

4.10.4 Radionuclide Decay Constant (λ)
The decay constant term (λ), which is based on the half-life of the isotope, is used for some media in nearly all land uses. λ = 0.693/half-life in years (where, 0.693=ln(2)). The term (1 - e-λt) takes into account the number of half-lives that will occur within the exposure duration to calculate an appropriate value. The intention of the +D term is to generate realistic risks by including the contributions from their short-lived decay products, assuming equal activity concentrations (i.e. , secular equilibrium) with the principal or parent nuclide in the environment. (Note that there is one exception to the assumption of secular equilibrium. For the inhalation slope factor for Rn-222+D reported in the table, EPA assumes a 50% equilibrium value for radon decay products (Po-218, Pb-214, Bi-214and Po-214) in air. ) In most cases, site-specific analytical data should be used to establish the actual degree of equilibrium between each parent radionuclide and its decay products in each media sampled. However, in the absence of empirical data, the "+D" values for radionuclides should be used unless there are compelling reasons not to do so. Definitions of the input variables are in Section 5.
4.10.5 Area Correction Factor
The RAGS/HHEM Part B model assumes that an individual is exposed to a source geometry that is effectively an infinite slab. The concept of an infinite slab means that the thickness of the contaminated zone and its aerial extent are so large that it behaves as if it were infinite in its physical dimensions. In practice, soil contaminated to a depth greater than about 15 cm and with an aerial extent greater than about 1,000 m2 will create a radiation field comparable to that of an infinite slab. (U.S. EPA. 2000a)
To accommodate the fact that in most residential settings the assumption of an infinite slab source will result in overly conservative SSLs, an adjustment for source area is considered to be an important modification to the RAGS/HHEM Part B model. Thus, an area correction factor, ACF, has been added to the calculation of SSLs. (U.S. EPA. 2000a)
For further description of the ACF, follow the link here.
4.10.6 Gamma Shielding Factor
CDIs in this guidance are calculated without any shielding between them and the source (soil). In this case, a default soil gamma shielding factor for outdoor exposure to ionizing radiation (GSFo is established at 1.0 (0% shielding). It is common to have some shielding (soil cover) over contaminated soil. When the calculator is ran in site-specific mode the user must select a soil cover depth. Due to shielding, covering the contaminated area with soil will produce lower dose and risk coefficients that are stated in the Federal Guidance Report (FGR) 12 and 13. Therefore, gamma shielding factors are needed to apply the published EPA risk values to the buried contamination scenarios. Outdoor gamma shielding factors (GSFo) are derived by modeling various thicknesses of clean soil covering ground soil contamination. The gamma shielding factor is defined as the ratio of the dose corresponding to covered contamination to that of an unshielded surface source in soil. The MCNP output was used to derive kerma values one meter above the soil surface for various scenarios ranging from 0 cm soil cover to 100 cm soil cover in 10 cm increments while using source thicknesses of ground plane, 1, 5 and 15 cm source volumes as well as infinite source volume. Radioisotopes published in ICRP 107 were considered, along with decay chains of several radioisotopes. The Center for Radiation Protection Knowledge has provided GSFo values here and an appendix containing +D and +E values.
A default gamma shielding factor for indoor exposure to ionizing radiation (GSFi is established at 0.4 (60% shielding)
A default gamma shielding factor for exposure to ionizing radiation in air (GSFa is established at 1 (0% shielding)
4.10.8 Modeling Parameters for Animals and Animal Products
Pasture Mass Loading Factor (MLFpasture)
The plant mass loading factor is defined as the ratio of the mass of soil on vegetation per mass of dry vegetation (Hinton, 1992). The mass loading factor is strictly the amount of soil that is resuspended and then remains on the plant which differs from incidental ingestion of soil by an animal.
Transfer Factor (TF)
The ratio of contaminant concentration in animal tissue (mg contaminant/kg tissue, wet weight) to daily intake (mg contaminant/day) is defined as the biotransfer factor (TF). It is a measure of how much of what the animal ingests is actually transferred to tissue. The TF (day/kg) is multiplied by a species-specific fodder ingestion rate (kg/day) and by the contaminant concentration in food (Rupp + Res) to obtain an estimate of the concentration in meat (mg contaminant/kg tissue). TFs are radionuclide- and species-specific.
Fodder Intake Rate (Qp)
Animal fodder intake rates are sometimes reported as wet weight and sometimes as dry weight. Since the soil to plant transfer factors (BV) for plants are reported on a dry weight basis, daily food intake rates should also be in dry weight.
Soil Intake Rate (Qs)
Soil ingestion by animals can be a significant exposure route. Animals may ingestion soil incidentally during grazing, grooming activities, or deliberately in search of minerals.
Water Intake Rate (Qw)
Animal water ingestion rates vary by species, dry matter intake, body size, productivity, and environmental condition.
Fraction of Time Animal is On-Site (fp)
This parameter accounts for the period of time which an animal is likely to be exposed to contaminants on the site. For livestock, this is the time on pasture. In some geographic regions, animals are only on pasture for a portion of the year. Site-specific values are desirable as grazing practices vary considerably with geographic region.
Fraction of Animal's Food from Site when On-Site (fs)
Supplemental feeding of livestock on pasture is a common management practice, therefore, a parameter to account for the fraction of an animal's daily food ingestion that comes from a site has been included in the exposure model.
Fraction of Animal's Water from Site when On-Site (fw)
The fraction of an animal’s daily water intake that is obtained from water at a site. Generally, animals are assumed to obtain 100% of their water from the site unless site conditions or management practices are known to influence access to site-related water.
5. Recommended Default Exposure Parameters
The tables below present the definitions of the variables and their default values. This calculator follows the recommendations in the OSWER Directive concerning use of exposure parameters from the 2011 Exposure Factors Handbook. Any alternative values or assumptions used in remedy evaluation or selection on a CERCLA site should be presented with supporting rationale in Administrative Records.
Table 1. Slope Factors (SFs)
Symbol Definition (units) Default Reference SFs Soil Ingestion Slope Factor - population (risk/pCi) Isotope-specific ORNL 2014c SFsa Soil Ingestion Slope Factor - adult only (risk/pCi) Isotope-specific ORNL 2014c SFf Food Ingestion Slope Factor (risk/pCi) Isotope-specific ORNL 2014c SFw Water Ingestion Slope Factor (risk/pCi) Isotope-specific ORNL 2014c SFi Slope Factor - inhalation (risk/pCi) Isotope-specific ORNL 2014c SFext-sv Slope Factor - external exposure (risk/yr per pCi/g) Isotope-specific ORNL 2014c SFext-sv1 Slope Factor - external exposure (risk/yr per pCi/g) Isotope-specific ORNL 2014c SFext-sv5 Slope Factor - external exposure (risk/yr per pCi/g) Isotope-specific ORNL 2014c SFext-sv15 Slope Factor - external exposure (risk/yr per pCi/g) Isotope-specific ORNL 2014c SFext-gp Slope Factor - external exposure (risk/yr per pCi/cm2) Isotope-specific ORNL 2014c SFsub Slope Factor - submersion (risk/yr per pCi/cm3) Isotope-specific ORNL 2014c SFimm Slope Factor - immersion (risk/yr per pCi/L) Isotope-specific ORNL 2014c Table 2. Miscellaneous Variables
Symbol Definition (units) Default Reference Csoil Concentration of contaminant in soil (pCi/g) User-input Cg-water concentration of contaminant in groundwater (pCi/L) User-input Cs-water concentration of contaminant in surface water (pCi/L) User-input Cair concentration of contaminant in air (pCi/m3) User-input Cfish concentration of contaminant in fish (pCi/g) User-input Cproduce concentration of contaminant in produce (pCi/g) User-input Cmilk concentration of contaminant in milk (pCi/g) User-input Cbeef concentration of contaminant in beef (pCi/g) User-input Cpoultry Concentration of contaminant in poultry (pCi/g) User-input Cegg Concentration of contaminant in egg (pCi/g) User-input Cswine Concentration of contaminant in swine (pCi/g) User-input Cgame Concentration of contaminant in game (pCi/g) User-input Cfowl Concentration of contaminant in fowl (pCi/g) User-input λ decay constant = 0.693/half-life (year-1) where 0.693 = ln(2) Isotope-specific Developed for Radionuclide Soil Screening calculator K Andelman Volatilization Factor (L/m3) 0.5 U.S. EPA 1991b (pg. 20) ACFext-sv Area Correction Factor - soil volume (unitless) Isotope-specific ORNL 2014a ACFext-sv1 Area Correction Factor - sv1 (unitless) Isotope-specific ORNL 2014a ACFext-sv5 Area Correction Factor - sv5 (unitless) Isotope-specific ORNL 2014a ACFext-sv15 Area Correction Factor - sv15 (unitless) Isotope-specific ORNL 2014a ACFext-gp Area Correction Factor - ground plane (unitless) Isotope-specific ORNL 2014a GSFi Gamma Shielding Factor - Indoor (unitless) 0.4 U.S. EPA 2000a. (pg. 2-22). U.S. EPA 2000b. (pg. 2-18) GSFext-sv Gamma Shielding Factor - soil volume (unitless) Isotope-specific ORNL 2014a GSFext-sv1 Gamma Shielding Factor - sv1 (unitless) Isotope-specific ORNL 2014b GSFext-sv5 Gamma Shielding Factor - sv5 (unitless) Isotope-specific ORNL 2014b GSFext-sv15 Gamma Shielding Factor - sv15 (unitless) Isotope-specific ORNL 2014b GSFext-gp Gamma Shielding Factor - ground plane (unitless) Isotope-specific ORNL 2014b GSFa Gamma Shielding Factor - Air (unitless) 1 Developed for Radionuclide Soil Screening calculator Table 3. Resident Soil
Symbol Definition (units) Default Reference CDIres-sol-ing Resident Soil Radionuclide Ingestion (pCi) Contaminant-specific Determined in this calculator CDIres-sol-inh Resident Soil Radionuclide Inhalation (pCi) Contaminant-specific Determined in this calculator CDIres-sol-ext Resident Soil Radionuclide External (pCi-year/g) Contaminant-specific Determined in this calculator CDIres-sol-sv Resident Soil Radionuclide External (pCi-year/g) Contaminant-specific Determined in this calculator CDIres-sol-sv1 Resident Soil Radionuclide External (pCi-year/g) Contaminant-specific Determined in this calculator CDIres-sol-sv5 Resident Soil Radionuclide External (pCi-year/g) Contaminant-specific Determined in this calculator CDIres-sol-sv15 Resident Soil Radionuclide External (pCi-year/g) Contaminant-specific Determined in this calculator CDIres-sol-gp Resident Soil Radionuclide External (pCi-year/cm2) Contaminant-specific Determined in this calculator tres Time - resident (years) 26 U.S. EPA 2011a, Table 16-108; 90th percentile or current residence time. CFres-produce Produce Contaminated Fraction - resident (unitless) 0.25 U.S. EPA 1990. U.S. EPA. 1998. (pg. C-9) Bvwet Soil to Plant Transfer Factor - wet (pCi/g-fresh plant per pCi/g-dry soil) Radionuclide-specific Hierarchy selection in Section 2.3.2 Rupv Wet root uptake for produce multiplier (unitless) Radionuclide-specific (=Bvwet) Hierarchy selection in Section 2.3.2 Res Soil resuspension multiplier (dimensionless) =MLF (pasture or produce) Hinton 1992 IFSres-adj Resident Ingestion Fraction - age-adjusted (mg) 1,120,000 Calculated using the age-adjusted intake factors equation. IRSres-a Resident Soil Ingestion Rate - adult (mg/day) 100 U.S. EPA 1991a (pg. 15) IRSres-c Resident Soil Ingestion Rate - child (mg/day) 200 U.S. EPA 1991a (pg. 15) IFAres-adj Resident Inhalation Rate - age-adjusted (m3) 161,100 Calculated using the age-adjusted intake factors equation. IRAres-a Resident Inhalation Rate - adult (m3/day) 20 U.S. EPA 1991a (pg. 15) IRAres-c Resident Inhalation Rate - child (m3/day) 10 U.S. EPA 1997a (pg. 5-11) IFVres-adj Resident Vegetable Ingestion Fraction - age-adjusted (g) 989,870 Calculated using the age-adjusted intake factors equation IRVres-a Resident Vegetable Ingestion Rate - adult (g/day) 128.9 U.S. EPA 2011 (Table 13-10) IRVres-c Resident Vegetable Ingestion Rate - child (g/day) 41.7 U.S. EPA 2011 (Table 13-10) IFFres-adj Resident Fruit Ingestion Fraction - age-adjusted (g) 1,462,510 Calculated using the age-adjusted intake factors equation IRFres-a Resident Fruit Ingestion Rate - adult (g/day) 188.5 U.S. EPA 2011 (Table 13-5) IRFres-c Resident Fruit Ingestion Rate - child (g/day) 68.1 U.S. EPA 2011 (Table 13-5) EFres Resident Exposure Frequency - (days/year) 350 U.S. EPA 1991a (pg. 15) EFres-a Resident Exposure Frequency - adult (days/year) 350 U.S. EPA 1991a (pg. 15) EFres-c Resident Exposure Frequency - child (days/year) 350 U.S. EPA 1991a (pg. 15) EDres Resident Exposure Duration (years) 26 U.S. EPA 2011a, Table 16-108; 90th percentile or current residence time. EDres-a Resident Exposure Duration - adult (years) 20 EDres (26 years) - EDres-c (6 years) EDres-c Resident Exposure Duration - child (years) 6 U.S. EPA 1991a, Pages 6 and 15 ETres Resident Exposure Time (hours/day) 24 24 Hours per 24 hour Day ETres-a Resident Exposure Time - adult (hours/day) 24 24 Hours per 24 hour Day ETres-c Resident Exposure Time - child (hours/day) 24 24 Hours per 24 hour Day ETres-i Resident Exposure Time - indoor (hours/day) 16.416 U.S. EPA 2011 (Table 16-16 50th%) ETres-o Resident Exposure Time - outdoor (hours/day) 1.752 U.S. EPA 2011 (Table 16-20 50th%)) Table 4. Indoor Worker Soil
Symbol Definition (units) Default Reference CDIind-sol-ing Indoor Worker Soil Radionuclide Ingestion (pCi) Contaminant-specific Determined in this calculator CDIind-sol-inh Indoor Worker Soil Radionuclide Inhalation (pCi) Contaminant-specific Determined in this calculator CDIind-sol-ext Indoor Worker Soil Radionuclide External (pCi-year/g) Contaminant-specific Determined in this calculator CDIind-sol-sv Indoor Worker Soil Radionuclide External (pCi-year/g) Contaminant-specific Determined in this calculator CDIind-sol-sv1 Indoor Worker Soil Radionuclide External (pCi-year/g) Contaminant-specific Determined in this calculator CDIind-sol-sv5 Indoor Worker Soil Radionuclide External (pCi-year/g) Contaminant-specific Determined in this calculator CDIind-sol-sv15 Indoor Worker Soil Radionuclide External (pCi-year/g) Contaminant-specific Determined in this calculator CDIind-sol-gp Indoor Worker Soil Radionuclide External (pCi-year/cm2) Contaminant-specific Determined in this calculator tind Time - indoor worker (years) 25 U.S. EPA 1991a (pg. 15) IRSind Indoor Worker Soil Ingestion Rate (mg/day) 50 U.S. EPA 2001 (pg. 4-3) IRAind Indoor Worker Inhalation Rate (m3/day; based on a rate of 2.5m3/hour for 24 hours) 60 U.S. EPA 1997a (pg. 5-11) EFind Indoor Worker Exposure Frequency (days/year) 250 U.S. EPA 1991a (pg. 15) EDind Indoor Worker Exposure Duration (years) 25 U.S. EPA 1991a (pg. 15) ETind Indoor Worker Exposure Time (hours/day) 8 Eight Hours per 24 hour Day Table 5. Outdoor Worker Soil
Symbol Definition (units) Default Reference CDIout-sol-ing Outdoor Worker Soil Radionuclide Ingestion (pCi) Contaminant-specific Determined in this calculator CDIout-sol-inh Outdoor Worker Soil Radionuclide Inhalation (pCi) Contaminant-specific Determined in this calculator CDIout-sol-ext Outdoor Worker Soil Radionuclide External (pCi-year/g) Contaminant-specific Determined in this calculator CDIout-sol-sv Outdoor Worker Soil Radionuclide External (pCi-year/g) Contaminant-specific Determined in this calculator CDIout-sol-sv1 Outdoor Worker Soil Radionuclide External (pCi-year/g) Contaminant-specific Determined in this calculator CDIout-sol-sv5 Outdoor Worker Soil Radionuclide External (pCi-year/g) Contaminant-specific Determined in this calculator CDIout-sol-sv15 Outdoor Worker Soil Radionuclide External (pCi-year/g) Contaminant-specific Determined in this calculator CDIout-sol-gp Outdoor Worker Soil Radionuclide External (pCi-year/cm2) Contaminant-specific Determined in this calculator tout Time - outdoor worker (years) 25 U.S. EPA 1991a (pg. 15) IRSout Outdoor Worker Soil Ingestion Rate (mg/day) 100 U.S. EPA 1991a (pg. 15) IRAout Outdoor Worker Inhalation Rate (m3/day; based on a rate of 2.5m3/hour for 24 hours) 60 U.S. EPA 1997a (pg. 5-11) EFout Outdoor Worker Exposure Frequency (days/year) 225 U.S. EPA 1991a (pg. 15) EDout Outdoor Worker Exposure Duration (years) 25 U.S. EPA 1991a (pg. 15) ETout Outdoor Worker Exposure Time (hours/day) 8 Eight Hours per 24 hour Day Table 6. Composite Worker Soil
Symbol Definition (units) Default Reference CDIcom-sol-ing Composite Worker Soil Radionuclide Ingestion (pCi) Contaminant-specific Determined in this calculator CDIcom-sol-inh Composite Worker Soil Radionuclide Inhalation (pCi) Contaminant-specific Determined in this calculator CDIcom-sol-ext Composite Worker Soil Radionuclide External (pCi-year/g) Contaminant-specific Determined in this calculator CDIcom-sol-sv Composite Worker Soil Radionuclide External (pCi-year/g) Contaminant-specific Determined in this calculator CDIcom-sol-sv1 Composite Worker Soil Radionuclide External (pCi-year/g) Contaminant-specific Determined in this calculator CDIcom-sol-sv5 Composite Worker Soil Radionuclide External (pCi-year/g) Contaminant-specific Determined in this calculator CDIcom-sol-sv15 Composite Worker Soil Radionuclide External (pCi-year/g) Contaminant-specific Determined in this calculator CDIcom-sol-gp Composite Worker Soil Radionuclide External (pCi-year/cm2) Contaminant-specific Determined in this calculator tcom Time - worker (years) 25 U.S. EPA 1991a (pg. 15) IRScom Composite Worker Soil Ingestion Rate (mg/day) 100 U.S. EPA 1991a (pg. 15) IRAcom Composite Worker Inhalation Rate (m3/day; based on a rate of 2.5m3/hour for 24 hours) 60 U.S. EPA 1997a (pg. 5-11) EFcom Composite Worker Exposure Frequency (days/year) 250 U.S. EPA 1991a (pg. 15) EDcom Composite Exposure Duration (years) 25 U.S. EPA 1991a (pg. 15) ETcom Composite Worker Exposure Time (hours/day) 8 Eight Hours per 24 hour Day Table 7. Excavation Worker Soil
Symbol Definition (units) Default Reference CDIexc-sol-ing Excavation Worker Soil Radionuclide Ingestion (pCi) Contaminant-specific Determined in this calculator CDIexc-sol-inh Excavation Worker Soil Radionuclide Inhalation (pCi) Contaminant-specific Determined in this calculator CDIexc-sol-ext Excavation Worker Soil Radionuclide External (pCi-year/g) Contaminant-specific Determined in this calculator texc Time - excavation worker (years) 1 U.S. EPA 2002 Exhibit 5-1 IRSexc Excavation Worker Soil Ingestion Rate (mg/day) 330 U.S. EPA 2002 (Exhibit 1-2) IRAexc Excavation Worker Inhalation Rate (m3/day; based on a rate of 2.5m3/hour for 24 hours) 60 U.S. EPA 1997a (pg. 5-11) EFexc Excavation Worker Exposure Frequency (days/year) 20 Based on 5 days per week for 4 weeks EDexc Excavation Worker Exposure Duration (years) 1 U.S. EPA 2002 Exhibit 5-1 ETexc-o Excavation Worker Exposure Time (hours/day) 8 Eight Hours per 24 hour Day Table 8. Construction Worker Soil
Symbol Definition (units) Default Reference CDIcon-sol-ing Construction Worker Soil Radionuclide Ingestion (pCi) Contaminant-specific Determined in this calculator CDIcon-sol-inh Construction Worker Soil Radionuclide Inhalation (pCi) Contaminant-specific Determined in this calculator CDIcon-sol-ext Construction Worker Soil Radionuclide External (pCi-year/g) Contaminant-specific Determined in this calculator CDIcon-sol-sv Construction Worker Soil Radionuclide External (pCi-year/g) Contaminant-specific Determined in this calculator CDIcon-sol-sv1 Construction Worker Soil Radionuclide External (pCi-year/g) Contaminant-specific Determined in this calculator CDIcon-sol-sv5 Construction Worker Soil Radionuclide External (pCi-year/g) Contaminant-specific Determined in this calculator CDIcon-sol-sv15 Construction Worker Soil Radionuclide External (pCi-year/g) Contaminant-specific Determined in this calculator CDIcon-sol-gp Construction Worker Soil Radionuclide External (pCi-year/cm2) Contaminant-specific Determined in this calculator tcon Time - construction worker (years) 1 U.S. EPA 2002 Exhibit 5-1 IRScon Construction Worker Soil Ingestion Rate (mg/day) 330 U.S. EPA 2002 (Exhibit 1-2) IRAcon Construction Worker Inhalation Rate (m3/day; based on a rate of 2.5m3/hour for 24 hours) 60 U.S. EPA 1997a (pg. 5-11) EFcon Construction Worker Exposure Frequency (days/year) 250 U.S. EPA 2002 Exhibit 5-1 EWcon Construction Worker Exposure Frequency (weeks/year) 50 U.S. EPA 2002 Exhibit 5-1 DWcon Construction Worker Exposure Frequency (days/week) 5 U.S. EPA 2002 Exhibit 5-1 EDcon Construction Worker Exposure Duration (years) 1 U.S. EPA 2002 Exhibit 5-1 ETcon Construction Worker Exposure Time (hours/day) 8 Eight Hours per 24 hour Day Table 9. Recreator Soil/Sediment
Symbol Definition (units) Default Reference CDIrec-sol-ing Recreator Soil Radionuclide Ingestion (pCi) Contaminant-specific Determined in this calculator CDIrec-sol-inh Recreator Soil Radionuclide Inhalation (pCi) Contaminant-specific Determined in this calculator CDIrec-sol-ext Recreator Soil Radionuclide External (pCi-year/g) Contaminant-specific Determined in this calculator CDIrec-sol-sv Recreator Soil Radionuclide External (pCi-year/g) Contaminant-specific Determined in this calculator CDIrec-sol-sv1 Recreator Soil Radionuclide External (pCi-year/g) Contaminant-specific Determined in this calculator CDIrec-sol-sv5 Recreator Soil Radionuclide External (pCi-year/g) Contaminant-specific Determined in this calculator CDIrec-sol-sv15 Recreator Soil Radionuclide External (pCi-year/g) Contaminant-specific Determined in this calculator CDIrec-sol-gp Recreator Soil Radionuclide External (pCi-year/cm2) Contaminant-specific Determined in this calculator CDIrec-sol-fowl-ing Recreator Fowl Radionuclide Back-calculated Concentration in Soil Ingestion (pCi) Contaminant-specific Determined in this calculator CDIrec-sol-game-ing Recreator Game Radionuclide Back-calculated Concentration in Soil Ingestion (pCi) Contaminant-specific Determined in this calculator trec Time - recreator (years) Site-specific Site-specific IFSrec-adj Recreator Ingestion Fraction - age-adjusted (mg) 240,000 Calculated using the age-adjusted intake factors equation. IRSrec-a Recreator Soil Ingestion Rate - adult (mg/day) 100 U.S. EPA 1991a (pg. 15) IRSrec-c Recreator Soil Ingestion Rate - child (mg/day) 200 U.S. EPA 1991a (pg. 15) IFArec-adj Recreator Inhalation Fraction - age-adjusted (m3) 1,437.5 Calculated using the age-adjusted intake factors equation. IRArec-a Recreator Inhalation Rate - adult (m3/day) 20 U.S. EPA 1991a (pg. 15) IRArec-c Recreator Inhalation Rate - child (m3/day) 10 U.S. EPA 1997a (pg. 5-11) EFrec Recreator Exposure Frequency - (days/year) 75 reasonable estimate. See 4.7.1 EFrec-a Recreator Exposure Frequency - adult (days/year) 75 reasonable estimate. See 4.7.1 EFrec-c Recreator Exposure Frequency - child (days/year) 75 reasonable estimate. See 4.7.1 EDrec Recreator Exposure Duration (years) 26 U.S. EPA 2011a, Table 16-108; 90th percentile or current residence time. EDrec-a Recreator Exposure Duration - adult (years) 20 EDres (26 years) - EDres-c (6 years) EDrec-c Recreator Exposure Duration - child (years) 6 U.S. EPA 1991a, Pages 6 and 15 ETrec Recreator Exposure Time (hours/day) 1 reasonable estimate. See 4.7.1 ETrec-a Recreator Exposure Time - adult (hours/day) 1 reasonable estimate. See 4.7.1 ETrec-c Recreator Exposure Time - child (hours/day) 1 reasonable estimate. See 4.7.1 IRGLrec-game Recreator Land Game Ingestion Rate (g/day) Site-specific Site-specific IRGFrec-fowl Recreator Fowl Ingestion Rate (g/day) Site-specific Site-specific CFrec-game Game Contaminated Fraction - farmer (unitless) 1 Developed for Radionuclide Soil Screening calculator CFrec-fowl Fowl Contaminated Fraction - farmer (unitless) 1 Developed for Radionuclide Soil Screening calculator Bvdry Soil to Plant Transfer Factor - dry (pCi/g-dry plant per pCi/g-dry soil) Radionuclide-specific Hierarchy selection in Section 2.3.2 Rupp Dry root uptake for pasture multiplier (dimensionless) Radionuclide-specific (=Bvdry) Hierarchy selection in Section 2.3.2 TFbeef Game Transfer Factor (day/kg) Radionuclide-specific Hierarchy selection in Section 2.3.2 TFpoultry Fowl Transfer Factor (day/kg) Radionuclide-specific Hierarchy selection in Section 2.3.2 Qp-game Game Fodder Intake Rate (kg/day) Site-specific Site-specific Qp-fowl Fowl Fodder Intake Rate (kg/day) Site-specific Site-specific Qs-game Game Soil Intake Rate (kg/day) Site-specific Site-specific Qs-fowl Fowl Soil Intake Rate (kg/day) Site-specific Site-specific fp-game Fraction of Time Animal is On-Site - game (unitless) 1 Assumes 100% fp-fowl Fraction of Time Animal is On-Site - fowl (unitless) 1 Assumes 100% fs-game Fraction of Animal's Food from Site when On-Site - game (unitless) 1 Assumes 100% fs-fowl Fraction of Animal's Food from Site when On-Site - fowl (unitless) 1 Assumes 100% Table 10. Farmer Soil
Symbol Definition (units) Default Reference CDIfar-sol-ing Farmer Soil Radionuclide Ingestion (pCi) Contaminant-specific Determined in this calculator CDIfar-sol-inh Farmer Soil Radionuclide Inhalation (pCi) Contaminant-specific Determined in this calculator CDIfar-sol-ext Farmer Soil Radionuclide External (pCi-year/g) Contaminant-specific Determined in this calculator CDIfar-sol-produce-ing Farmer Produce Radionuclide Back-calculated Concentration in Soil Ingestion (pCi) Contaminant-specific Determined in this calculator CDIfar-sol-poultry-ing Farmer Poultry Radionuclide Back-calculated Concentration in Soil Ingestion (pCi) Contaminant-specific Determined in this calculator CDIfar-sol-egg-ing Farmer Egg Radionuclide Back-calculated Concentration in Soil Ingestion (pCi) Contaminant-specific Determined in this calculator CDIfar-sol-beef-ing Farmer Beef Radionuclide Back-calculated Concentration in Soil Ingestion (pCi) Contaminant-specific Determined in this calculator CDIfar-sol-dairy-ing Farmer Dairy Radionuclide Back-calculated Concentration in Soil Ingestion (pCi) Contaminant-specific Determined in this calculator CDIfar-sol-swine-ing Farmer Swine Radionuclide Back-calculated Concentration in Soil Ingestion (pCi) Contaminant-specific Determined in this calculator CDIfar-sol-fsh-ing Farmer Fish Radionuclide Back-calculated Concentration in Soil Ingestion (pCi) Contaminant-specific Determined in this calculator ρm Density of milk (kg/L) 1.03 Physical Properties of Milk tfar Time - farmer (years) 40 U.S. EPA 2005 (pg. C-24/C-26) Bvwet Soil to Plant Transfer Factor - wet (pCi/g-fresh plant per pCi/g-dry soil) Radionuclide-specific Hierarchy selection in Section 2.3.2 Bvdry Soil to Plant Transfer Factor - dry (pCi/g-dry plant per pCi/g-dry soil) Radionuclide-specific Hierarchy selection in Section 2.3.2 Rupv Dry root uptake for produce multiplier (unitless) Radionuclide-specific (=Bvwet) Hierarchy selection in Section 2.3.2 Rupp Dry root uptake for pasture multiplier (dimensionless) Radionuclide-specific (=Bvdry) Hierarchy selection in Section 2.3.2 Res Soil resuspension multiplier (dimensionless) =MLF (pasture or produce) Hinton 1992 TFbeef Beef Transfer Factor (day/kg) Radionuclide-specific Hierarchy selection in Section 2.3.2 TFdairy Dairy Transfer Factor (day/L) Radionuclide-specific Hierarchy selection in Section 2.3.2 TFswine Swine Transfer Factor (day/kg) Radionuclide-specific Hierarchy selection in Section 2.3.2 TFpoultry Poultry Transfer Factor (day/kg) Radionuclide-specific Hierarchy selection in Section 2.3.2 TFegg Egg Transfer Factor (day/kg) Radionuclide-specific Hierarchy selection in Section 2.3.2 MLFproduce Produce Plant Mass Loading Factor (unitless) 0.26 x 0.052 = 0.0135 Hinton, 1992. U.S. EPA SSG 1996 table G-1. Dry weight to wet weight conversion equation from section 4.10.7. MLFpasture Pasture Plant Mass Loading Factor (unitless) 0.25 Hinton, T. G. 1992 Qp-beef Beef Fodder Intake Rate (kg/day) 11.77 U.S. EPA 2005 (pg. B-138) Qp-dairy Dairy Fodder Intake Rate (kg/day) 20.3 U.S. EPA 2005 (pg. B-145) Qp-swine Swine Fodder Intake Rate (kg/day) 4.7 U.S. EPA 2005 (pg. B-152) Qp-poultry Poultry Fodder Intake Rate (kg/day) 0.2 U.S. EPA 2005 (pg. B-158/164) Qs-beef Beef Soil Intake Rate (kg/day) 0.5 U.S. EPA 2005 (pg. B-139) Qs-dairy Dairy Soil Intake Rate (kg/day) 0.4 U.S. EPA 2005 (pg. B-146) Qs-swine Swine Soil Intake Rate (kg/day) 0.37 U.S. EPA 2005 (pg. B-153) Qs-poultry Poultry Soil Intake Rate (kg/day) 0.022 U.S. EPA 2005 (pg. B-159/165) fp-beef Fraction of Time Animal is On-Site - beef (unitless) 1 Developed for this calculator fp-dairy Fraction of Time Animal is On-Site - dairy (unitless) 1 Developed for this calculator fp-swine Fraction of Time Animal is On-Site - swine (unitless) 1 Developed for this calculator fp-poultry Fraction of Time Animal is On-Site - poultry (unitless) 1 Developed for this calculator fs-beef Fraction of Animal's Food from Site when On-Site - beef (unitless) 1 Developed for this calculator fs-dairy Fraction of Animal's Food from Site when On-Site - dairy (unitless) 1 Developed for this calculator fs-swine Fraction of Animal's Food from Site when On-Site - swine (unitless) 1 Developed for this calculator fs-poultry Fraction of Animal's Food from Site when On-Site - poultry (unitless) 1 Developed for this calculator IFSfar-adj Farmer Soil Ingestion Fraction - age-adjusted (mg) 1,610,000 Calculated using the age-adjusted intake factors equation. IRSfar-a Farmer Soil Ingestion Rate - adult (mg/day) 100 U.S. EPA 1991a (pg. 15) IFAfar-adj Farmer Inhalation Rate - age-adjusted (m3) 259,000 Calculated using the age-adjusted intake factors equation. IRAfar-a Farmer Inhalation Rate - adult (m3/day) 20 U.S. EPA 1991a (pg. 15) IRAfar-c Farmer Inhalation Rate - child (m3/day) 10 U.S. EPA 1997a (pg. 5-11) IRSfar-c Farmer Soil Ingestion Rate - child (mg/day) 200 U.S. EPA 1991a (pg. 15) EFfar Farmer Exposure Frequency (days/year) 350 U.S. EPA 1991a (pg. 15) EFfar-a Farmer Exposure Frequency - adult (days/year) 350 U.S. EPA 1991a (pg. 15) EFfar Farmer Exposure Frequency - child (days/year) 350 U.S. EPA 1991a (pg. 15) EDfar Farmer Exposure Duration (years) 40 U.S. EPA 2005 (Table 6-3) EDfar-a Farmer Exposure Duration - adult (years) 34 U.S. EPA 1994a EDfar-c Farmer Exposure Duration - child (years) 6 U.S. EPA 2005 (Table 6-3) ETfar Farmer Exposure Time - (hours/day) 24 24 Hours per 24 hour Day ETfar-a Farmer Exposure Time - Adult (hours/day) 24 24 Hours per 24 hour Day ETfar-c Farmer Exposure Time - Child (hours/day) 24 24 Hours per 24 hour Day ETfar-i Farmer Exposure Time - indoor (hours/day) 10.008 1440 hrs/day - (ETfar-o + ETfar-a) ETfar-away Farmer Exposure Time - away (hours/day) 1.83 U.S. EPA 2011 (Tables 16-20 and 16-24 total of time in vehicles, near vehicles and outdoors other than near residence 25th%) ETfar-o Farmer Exposure Time - outdoor (hours/day) 12.168 U.S. EPA 2011 (Table 16-20 95th%)) Table 11. Resident Tap Water
Symbol Definition (units) Default Reference CDIres-wat-ing Resident Tap Water (Groundwater) Radionuclide Ingestion (pCi) Contaminant-specific Determined in this calculator CDIres-wat-sub Resident Tap Water (Groundwater) Radionuclide Submersion (pCi) Contaminant-specific Determined in this calculator CDIres-wat-inh Resident Tap Water (Groundwater) Radionuclide Inhalation (pCi) Contaminant-specific Determined in this calculator CDIres-wat-imm Resident Tap Water (Groundwater) Radionuclide Immersion (pCi-year/L) Contaminant-specific Determined in this calculator Irrrup root uptake from irrigation multiplier (L/kg) Isotope-specific Calculated Irrres resuspension from irrigation multiplier (L/kg) Isotope-specific Calculated Irrdep aerial deposition from irrigation multiplier (L/kg) Isotope-specific Calculated Bvwet Soil to Plant Transfer Factor - wet (pCi/g-fresh plant per pCi/g-dry soil) Radionuclide-specific Hierarchy selection in Section 2.3.2 F Irrigation Period (unitless) 0.25 Personal communication If Interception Fraction (unitless) 0.42 Miller, C. W. 1980 Ir Irrigation Rate (L/m2) 3.62 Personal communication λHL Soil Leaching Rate (1/day) 0.000027 NCRP 1996 λi decay (1/day) 0.693/TR - radionuclides NCRP 1996 λE Decay for Removal on Produce (1/day) λi + (0.693/tw) NCRP 1996 λB Effective Rate for Removal (1/day) λHL - λi NCRP 1996 T Translocation Factor (unitless) 1 NCRP 1996 tb Long Term Deposition and Buildup (day) 10950 NCRP 1996 tv Above Ground Exposure Time (day) 60 NCRP 1996 tw Weathering Half-life (day) 14 NCRP 1996 Yv Plant Yield - wet (kg/m2) 2 NCRP 1996 P Area Density for Root Zone (kg/m2) 240 Hoffman, F. O., R. H. Gardner, and K. F. Eckerman. 1982; Peterson, H. T., Jr. 1983; McKone, T. E. 1994 MLFproduce Produce Plant Mass Loading Factor (unitless) 0.26 x 0.052 = 0.0135 Hinton, 1992. U.S. EPA SSG 1996 table G-1. Dry weight to wet weight conversion equation from section 4.10.7. IFWres-adj Resident Tap Water Ingestion Rate - age-adjusted (L) 19,138 Calculated using the age-adjusted intake factors equation. IRWres-a Resident Tap Water Ingestion - adult (L/day) 2.5 U.S. EPA 2011a, Tables 3-15 and 3-33; weighted average of 90th percentile consumer-only ingestion of drinking water (21+) IRWres-c Resident Tap Water Ingestion - child (L/day) 0.78 U.S. EPA 2011a, Tables 3-15 and 3-33; weighted average of 90th percentile consumer-only ingestion of drinking water (birth to < years) IFAres-adj Resident Inhalation Rate - age-adjusted (m3) 161,100 Calculated using the age-adjusted intake factors equation. DFAres-adj Resident Immersion Factor - age-adjusted (hours) 6104 Calculated using the age-adjusted intake factors equation. IRAres-a Resident Inhalation Rate - adult (m3/day) 20 U.S. EPA 1991a (pg. 15) IRAres-c Resident Inhalation Rate - child (m3/day) 10 U.S. EPA 1997a (pg. 5-11) IFVres-adj Resident Vegetable Ingestion Fraction - age-adjusted (g) 989,870 Calculated using the age-adjusted intake factors equation IRVres-a Resident Vegetable Ingestion Rate - adult (g/day) 128.9 U.S. EPA 2011 (Table 13-10) IRVres-c Resident Vegetable Ingestion Rate - child (g/day) 41.7 U.S. EPA 2011 (Table 13-10) IFFres-adj Resident Fruit Ingestion Fraction - age-adjusted (g) 1,462,510 Calculated using the age-adjusted intake factors equation IRFres-a Resident Fruit Ingestion Rate - adult (g/day) 188.5 U.S. EPA 2011 (Table 13-5) IRFres-c Resident Fruit Ingestion Rate - child (g/day) 68.1 U.S. EPA 2011 (Table 13-5) EFres Resident Exposure Frequency - (days/year) 350 U.S. EPA 1991a (pg. 15) EFres-a Resident Exposure Frequency - adult (days/year) 350 U.S. EPA 1991a (pg. 15) EFres-c Resident Exposure Frequency - child (days/year) 350 U.S. EPA 1991a (pg. 15) EDres Resident Exposure Duration (years) 26 U.S. EPA 2011a, Table 16-108; 90th percentile or current residence time. EDres-a Resident Exposure Duration - adult (years) 20 EDres (26 years) - EDres-c (6 years) EDres-c Resident Exposure Duration - child (years) 6 U.S. EPA 1991a, Pages 6 and 15 ETevent-res-a Resident Tap Water Exposure Time - Adult (hours/event) 0.71 U.S. EPA 1997a ETevent-res-c Resident Tap Water Exposure Time - Child (hours/event) 0.54 U.S. EPA 1997a EVres-a Number of bathing events per day - adult resident (events/day) 1 U.S. EPA 2004 Exhibit 3-2 EVres-c Number of bathing events per day - child resident (events/day) 1 U.S. EPA 2004 Exhibit 3-2 Table 12. Indoor Worker Tap Water
Symbol Definition (units) Default Reference CDIind-wat-ing Indoor Worker Tap Water Radionuclide Ingestion (pCi) Contaminant-specific Determined in this calculator CDIind-wat-inh Indoor Worker Tap Water Radionuclide Inhalation (pCi) Contaminant-specific Determined in this calculator CDIind-wat-imm Indoor Worker Tap Water Radionuclide Immersion (pCi/L-year) Contaminant-specific Determined in this calculator IRWind Indoor Worker Tap Water Ingestion (L/day) 1.25 U.S. EPA 2014, FAQ 13 EFind Indoor Worker Exposure Frequency (days/year) 250 U.S. EPA 1991a (pg. 15) EDind Indoor Worker Exposure Duration (years) 25 U.S. EPA 1991a (pg. 15) ETind Indoor Worker Exposure Time (hours/day) 8 Eight Hours per 24 hour Day ETevent-ind Indoor Worker Tap Water Exposure Time - adult (hours/event) 0.71 U.S. EPA 1997a EVind Number of bathing events per day - Indoor Worker (events/day) 1 U.S. EPA 2004 Exhibit 3-2 Table 13. Recreator Surface Water
Symbol Definition (units) Default Reference CDIrec-wat-ing Recreator Surface Water Radionuclide Ingestion (pCi) Contaminant-specific Determined in this calculator CDIrec-wat-imm Recreator Surface Water Radionuclide Immersion (pCi-year/L) Contaminant-specific Determined in this calculator CDIrec-wat-fowl-ing Recreator Fowl Radionuclide Back-calculated Concentration in Water Ingestion (pCi) Contaminant-specific Determined in this calculator CDIrec-wat-game-ing Recreator Game Radionuclide Back-calculated Concentration in Water Ingestion (pCi) Contaminant-specific Determined in this calculator IFWrec-adj Recreator Surface Water Ingestion - age-adjusted (L) 131.4 Calculated using the age-adjusted intake factors equation. IRWrec-a Recreator Surface water Ingestion - adult (L/hour) 0.11 Time weighted average was calculated based on the upper percentile from Table 3.7 of EFH 2019 IRWrec-c Recreator Surface water Ingestion - child (L/hour) 0.12 Table 3.5 in EFH 2011 DFArec-adj Recreator Immersion Factor - age-adjusted (hours) 1,170 Calculated using the age-adjusted intake factors equation. EFrec Recreator Exposure Frequency - (days/year) 45 Region 4 Bulletin EFrec-c Recreator Exposure Frequency - child (days/year) 45 Region 4 Bulletin EFrec-a Recreator Exposure Frequency - adult (days/year) 45 Region 4 Bulletin EDrec Recreator Exposure Duration (years) 26 U.S. EPA 2011a, Table 16-108; 90th percentile or current residence time. EDrec-a Recreator Exposure Duration - adult (years) 20 EDres (26 years) - EDres-c (6 years) EDrec-c Recreator Exposure Duration - child (years) 6 U.S. EPA 1991a, Pages 6 and 15 ETevent-rec-a Number of bathing events per day - adult recreator (events/day) 1 reasonable estimate. See 4.7.5 ETevent-rec-c Number of hours per bathing event - child recreator (hours/event) 1 reasonable estimate. See 4.7.5 EVrec-a Number of hours per bathing event - child recreator (hours/event) 1 reasonable estimate. See 4.7.5 EVrec-c Number of bathing events per day - child recreator (events/day) 1 reasonable estimate. See 4.7.5 IRGLrec-game Recreator Land Game Ingestion Rate (g/day) Site-specific Site-specific IRGFrec-fowl Recreator Fowl Ingestion Rate (g/day) Site-specific Site-specific TFbeef Game Transfer Factor (day/kg) Radionuclide-specific Hierarchy selection in Section 2.3.2 TFpoultry Fowl Transfer Factor (day/kg) Radionuclide-specific Hierarchy selection in Section 2.3.2 Qw-game Game Water Intake Rate (L/day) Site-specific Site-specific Qw-fowl Fowl Water Intake Rate (L/day) Site-specific Site-specific fw-game Fraction of Animal's Water from Site when On-Site - game (unitless) 1 Assumes 100% fw-fowl Fraction of Animal's Water from Site when On-Site - fowl (unitless) 1 Assumes 100% Table 14. Farmer Tap Water
Symbol Definition (units) Default Reference CDIfar-wat-ing Farmer Tap Water (Groundwater) Radionuclide Ingestion (pCi) Contaminant-specific Determined in this calculator CDIfar-wat-inh Farmer Tap Water (Groundwater) Radionuclide Inhalation (pCi) Contaminant-specific Determined in this calculator CDIfar-wat-imm Farmer Tap Water (Groundwater) Radionuclide Immersion (pCi-year/L) Contaminant-specific Determined in this calculator CDIfar-wat-produce-ing Farmer Produce Radionuclide Back-calculated Concentration in Water Ingestion (pCi) Contaminant-specific Determined in this calculator CDIfar-wat-poultry-ing Farmer Poultry Radionuclide Back-calculated Concentration in Water Ingestion (pCi) Contaminant-specific Determined in this calculator CDIfar-wat-egg-ing Farmer Egg Radionuclide Back-calculated Concentration in Water Ingestion (pCi) Contaminant-specific Determined in this calculator CDIfar-wat-beef-ing Farmer Beef Radionuclide Back-calculated Concentration in Water Ingestion (pCi) Contaminant-specific Determined in this calculator CDIfar-wat-dairy-ing Farmer Dairy Radionuclide Back-calculated Concentration in Water Ingestion (pCi) Contaminant-specific Determined in this calculator CDIfar-wat-swine-ing Farmer Swine Radionuclide Back-calculated Concentration in Water Ingestion (pCi) Contaminant-specific Determined in this calculator CDIfar-wat-fsh-ing Farmer Fish Radionuclide Back-calculated Concentration in Water Ingestion (pCi) Contaminant-specific Determined in this calculator ρm Density of milk (kg/L) 1.03 Physical Properties of Milk BCF Fish Transfer Factor (L/kg) Radionuclide-specific Hierarchy selection in Section 2.3.2 TFbeef Beef Transfer Factor (day/kg) Radionuclide-specific Hierarchy selection in Section 2.3.2 TFdairy Dairy Transfer Factor (day/L) Radionuclide-specific Hierarchy selection in Section 2.3.2 TFswine Swine Transfer Factor (day/kg) Radionuclide-specific Hierarchy selection in Section 2.3.2 TFpoultry Poultry Transfer Factor (day/kg) Radionuclide-specific Hierarchy selection in Section 2.3.2 TFegg Egg Transfer Factor (day/kg) Radionuclide-specific Hierarchy selection in Section 2.3.2 Qw-beef Beef Water Intake Rate (L/day) 53 U.S. EPA 1999a (pg 10-23). U.S. EPA 1997b. Qw-dairy Dairy Water Intake Rate (L/day) 92 U.S. EPA 1999a (pg 10-23). U.S. EPA 1997b. Qw-swine Swine Water Intake Rate (L/day) 11.4 NEC, Swine Nutrition Guide (pg. 19). U.S. EPA 1998 (pg B-180) Qw-poultry Poultry Water Intake Rate (L/day) 0.4 U.S. EPA 2005 (pg. B-159/165), NRC 1994 pg. 15 (Qw = 2 × Qp) Irrrup root uptake from irrigation multiplier Isotope-specific Calculated Irrres resuspension from irrigation multiplier Isotope-specific Calculated Irrdep Aerial deposition from irrigation multiplier Isotope-specific Calculated Bvwet Soil to Plant Transfer Factor - wet (pCi/g-fresh plant per pCi/g-dry soil) Radionuclide-specific Hierarchy selection in Section 2.3.2 F Irrigation Period (unitless) 0.25 Personal communication If Interception Fraction (unitless) 0.42 Miller, C. W. 1980 Ir Irrigation Rate (L/m2) 3.62 Personal communication λHL Soil Leaching Rate (1/day) 0.000027 NCRP 1996 λi decay (1/day) 0.693/TR - radionuclides NCRP 1996 λE Decay for Removal on Produce (1/day) λi + (0.693/tw) NCRP 1996 λB Effective Rate for Removal (1/day) λHL - λi NCRP 1996 T Translocation Factor (unitless) 1 NCRP 1996 tb Long Term Deposition and Buildup (day) 10950 NCRP 1996 tv Above Ground Exposure Time (day) 60 NCRP 1996 tw Weathering Half-life (day) 14 NCRP 1996 Yv Plant Yield - wet (kg/m2) 2 NCRP 1996 P Area Density for Root Zone (kg/m2) 240 Hoffman, F. O., R. H. Gardner, and K. F. Eckerman. 1982; Peterson, H. T., Jr. 1983; McKone, T. E. 1994 MLFproduce Produce Plant Mass Loading Factor (unitless) 0.26 x 0.052 = 0.0135 Hinton, 1992. U.S. EPA SSG 1996 table G-1. Dry weight to wet weight conversion equation from section 4.10.7. IFWfar-adj Farmer Water Ingestion Fraction - age-adjusted (L) 31,388 Calculated using the age-adjusted intake factors equation. IRWfar-a Farmer Water Ingestion Rate - adult (L/day) 2.5 U.S. EPA 2011a, Tables 3-15 and 3-33; weighted average of 90th percentile consumer-only ingestion of drinking water (21+) IRWfar-c Farmer Water Ingestion Rate - child (L/day) 0.78 U.S. EPA 2011a, Tables 3-15 and 3-33; weighted average of 90th percentile consumer-only ingestion of drinking water (birth to < years) IFAfar-adj Farmer Inhalation Rate - age-adjusted (m3) 259,000 Calculated using the age-adjusted intake factors equation. DFAfar-adj Farmer Immersion Factor - age-adjusted (hours) 9583 Calculated using the age-adjusted intake factors equation. IRAfar-a Farmer Inhalation Rate - adult (m3/day) 20 U.S. EPA 1991a (pg. 15) IRAfar-c Farmer Inhalation Rate - child (m3/day) 10 U.S. EPA 1997a (pg. 5-11) EFfar Farmer Exposure Frequency (days/year) 350 U.S. EPA 1991a (pg. 15) EFfar-a Farmer Exposure Frequency - adult (days/year) 350 U.S. EPA 1991a (pg. 15) EFfar Farmer Exposure Frequency - child (days/year) 350 U.S. EPA 1991a (pg. 15) EDfar Farmer Exposure Duration (years) 40 U.S. EPA 2005 (Table 6-3) EDfar-a Farmer Exposure Duration - adult (years) 34 U.S. EPA 1994a EDfar-c Farmer Exposure Duration - child (years) 6 U.S. EPA 2005 (Table 6-3) ETevent-far-c Farmer Tap Water Exposure Time - Child (hours/day) 0.54 U.S. EPA 1997a ETevent-far-a Farmer Tap Water Exposure Time - Adult (hours/day) 0.71 U.S. EPA 1997a EVfar-a Number of bathing events per day - adult farmer (events/day) 1 U.S. EPA 2004 Exhibit 3-2 EVfar-c Number of bathing events per day - child farmer (events/day) 1 U.S. EPA 2004 Exhibit 3-2 Table 15. Resident Air
Symbol Definition (units) Default Reference CDIres-air-inh-decay Resident Air Radionuclide Inhalation w/ Decay (pCi) Contaminant-specific Determined in this calculator CDIres-air-sub-decay Resident Air Radionuclide Submersion w/ Decay (pCi-year/m3) Contaminant-specific Determined in this calculator CDIres-air-inh-nodecay Resident Air Radionuclide Inhalation w/out Decay (pCi) Contaminant-specific Determined in this calculator CDIres-air-sub-nodecay Resident Air Radionuclide Submersion w/out Decay (pCi-year/m3) Contaminant-specific Determined in this calculator tres Time - resident (years) 26 U.S. EPA 2011a, Table 16-108; 90th percentile or current residence time. IFAres-adj Resident Inhalation Rate - age-adjusted (m3) 161,100 Calculated using the age-adjusted intake factors equation. IRAres-a Resident Inhalation Rate - adult (m3/day) 20 U.S. EPA 1991a (pg. 15) IRAres-c Resident Inhalation Rate - child (m3/day) 10 U.S. EPA 1997a (pg. 5-11) EFres Resident Exposure Frequency - (days/year) 350 U.S. EPA 1991a (pg. 15) EFres-c Resident Exposure Frequency - child (days/year) 350 U.S. EPA 1991a (pg. 15) EFres-a Resident Exposure Frequency - adult (days/year) 350 U.S. EPA 1991a (pg. 15) EDres Resident Exposure Duration (years) 26 U.S. EPA 2011a, Table 16-108; 90th percentile or current residence time. EDres-a Resident Exposure Duration - adult (years) 20 EDres (26 years) - EDres-c (6 years) EDres-c Resident Exposure Duration - child (years) 6 U.S. EPA 1991a, Pages 6 and 15 ETres Resident Exposure Time (hours/day) 24 24 Hours per 24 hour Day ETres-a Resident Exposure Time - adult (hours/day) 24 24 Hours per 24 hour Day ETres-c Resident Exposure Time - child (hours/day) 24 24 Hours per 24 hour Day Table 16. Indoor Worker Air
Symbol Definition (units) Default Reference CDIind-air-inh-decay Indoor Worker Air Radionuclide Inhalation w/ Decay (pCi/m3) Contaminant-specific Determined in this calculator CDIind-air-sub-decay Indoor Worker Air Radionuclide Submersion w/ Decay (pCi-year/m3) Contaminant-specific Determined in this calculator CDIind-air-inh-nodecay Indoor Worker Air Radionuclide Inhalation w/out Decay (pCi/m3) Contaminant-specific Determined in this calculator CDIind-air-sub-nodecay Indoor Worker Air Radionuclide Submersion w/out Decay (pCi-year/m3) Contaminant-specific Determined in this calculator IRAind Indoor Worker Inhalation Rate (m3/day; based on a rate of 2.5m3/hour for 24 hours) 60 U.S. EPA 1997a (pg. 5-11) EFind Indoor Worker Exposure Frequency (days/year) 250 U.S. EPA 1991a (pg. 15) EDind Indoor Worker Exposure Duration (years) 25 U.S. EPA 1991a (pg. 15) ETind Indoor Worker Exposure Time (hours/day) 8 Eight Hours per 24 hour Day Table 17. Outdoor Worker Air
Symbol Definition (units) Default Reference CDIout-air-inh-decay Outdoor Worker Air Radionuclide Inhalation w/ Decay (pCi/m3) Contaminant-specific Determined in this calculator CDIout-air-sub-decay Outdoor Worker Air Radionuclide Submersion w/ Decay (pCi-year/m3) Contaminant-specific Determined in this calculator CDIout-air-inh-nodecay Outdoor Worker Air Radionuclide Inhalation w/out Decay (pCi/m3) Contaminant-specific Determined in this calculator CDIout-air-sub-nodecay Outdoor Worker Air Radionuclide Submersion w/out Decay (pCi-year/m3) Contaminant-specific Determined in this calculator tout Time - outdoor worker (years) 25 U.S. EPA 1991a (pg. 15) IRAout Outdoor Worker Inhalation Rate (m3/day; based on a rate of 2.5m3/hour for 24 hours) 60 U.S. EPA 1997a (pg. 5-11) EFout Outdoor Worker Exposure Frequency (days/year) 225 U.S. EPA 1991a (pg. 15) EDout Outdoor Worker Exposure Duration (years) 25 U.S. EPA 1991a (pg. 15) ETout Outdoor Worker Exposure Time (hours/day) 8 Eight Hours per 24 hour Day Table 18. Composite Worker Air
Symbol Definition (units) Default Reference CDIcom-air-inh-decay Composite Worker Air Radionuclide Inhalation w/ Decay (pCi/m3) Contaminant-specific Determined in this calculator CDIcom-air-sub-decay Composite Worker Air Radionuclide Submersion w/ Decay (pCi-year/m3) Contaminant-specific Determined in this calculator CDIcom-air-inh-nodecay Composite Worker Air Radionuclide Inhalation w/out Decay (pCi/m3) Contaminant-specific Determined in this calculator CDIcom-air-sub-nodecay Composite Worker Air Radionuclide Submersion w/out Decay (pCi-year/m3) Contaminant-specific Determined in this calculator tcom Time - worker (years) 25 U.S. EPA 1991a (pg. 15) IRAcom Composite Worker Inhalation Rate (m3/day; based on a rate of 2.5m3/hour for 24 hours) 60 U.S. EPA 1997a (pg. 5-11) EFcom Composite Worker Exposure Frequency (days/year) 250 U.S. EPA 1991a (pg. 15) EDcom Composite Exposure Duration (years) 25 U.S. EPA 1991a (pg. 15) ETcom Composite Worker Exposure Time (hours/day) 8 Eight Hours per 24 hour Day Table 19. Excavation Worker Air
Symbol Definition (units) Default Reference CDIexc-air-inh-decay Excavation Worker Air Radionuclide Inhalation w/ Decay (pCi/m3) Contaminant-specific Determined in this calculator CDIexc-air-sub-decay Excavation Worker Air Radionuclide Submersion w/ Decay (pCi-year/m3) Contaminant-specific Determined in this calculator CDIexc-air-inh-nodecay Excavation Worker Air Radionuclide Inhalation w/out Decay (pCi/m3) Contaminant-specific Determined in this calculator CDIexc-air-sub-nodecay Excavation Worker Air Radionuclide Submersion w/out Decay (pCi-year/m3) Contaminant-specific Determined in this calculator texc Time - excavation worker (years) 1 U.S. EPA 2002 Exhibit 5-1 IRAexc Excavation Worker Inhalation Rate (m3/day; based on a rate of 2.5m3/hour for 24 hours) 60 U.S. EPA 1997a (pg. 5-11) EFexc Excavation Worker Exposure Frequency (days/year) 20 Based on 5 days per week for 4 weeks EDexc Excavation Worker Exposure Duration (years) 1 U.S. EPA 2002 Exhibit 5-1 ETexc-o Excavation Worker Exposure Time (hours/day) 8 Eight Hours per 24 hour Day Table 20. Construction Worker Air
Symbol Definition (units) Default Reference CDIcon-air-inh-decay Construction Worker Air Radionuclide Inhalation w/ Decay (pCi/m3) Contaminant-specific Determined in this calculator CDIcon-air-sub-decay Construction Worker Air Radionuclide Submersion w/ Decay (pCi-year/m3) Contaminant-specific Determined in this calculator CDIcon-air-inh-nodecay Construction Worker Air Radionuclide Inhalation w/out Decay (pCi/m3) Contaminant-specific Determined in this calculator CDIcon-air-sub-nodecay Construction Worker Air Radionuclide Submersion w/out Decay (pCi-year/m3) Contaminant-specific Determined in this calculator tcon Time - construction worker (years) 1 U.S. EPA 2002 Exhibit 5-1 IRAcon Construction Worker Inhalation Rate (m3/day; based on a rate of 2.5m3/hour for 24 hours) 60 U.S. EPA 1997a (pg. 5-11) EFcon Construction Worker Exposure Frequency (days/year) 250 U.S. EPA 2002 Exhibit 5-1 EWcon Construction Worker Exposure Frequency (weeks/year) 50 U.S. EPA 2002 Exhibit 5-1 DWcon Construction Worker Exposure Frequency (days/week) 5 U.S. EPA 2002 Exhibit 5-1 EDcon Construction Worker Exposure Duration (years) 1 U.S. EPA 2002 Exhibit 5-1 ETcon Construction Worker Exposure Time (hours/day) 8 Eight Hours per 24 hour Day Table 21. Recreator Air
Symbol Definition (units) Default Reference CDIrec-air-inh-decay Recreator Worker Air Radionuclide Inhalation w/ Decay (pCi/m3) Contaminant-specific Determined in this calculator CDIrec-air-sub-decay Recreator Worker Air Radionuclide Submersion w/ Decay (pCi-year/m3) Contaminant-specific Determined in this calculator CDIrec-air-inh-nodecay Recreator Worker Air Radionuclide Inhalation w/out Decay (pCi/m3) Contaminant-specific Determined in this calculator CDIrec-air-sub-nodecay Recreator Air Radionuclide Submersion w/out Decay (pCi-year/m3) Contaminant-specific Determined in this calculator trec Time - recreator (years) Site-specific Site-specific IFArec-adj Recreator Inhalation Fraction - age-adjusted (m3) 1,437.5 Calculated using the age-adjusted intake factors equation. IRArec-a Recreator Inhalation Rate - adult (m3/day) 20 U.S. EPA 1991a (pg. 15) IRArec-c Recreator Inhalation Rate - child (m3/day) 10 U.S. EPA 1997a (pg. 5-11) EFrec Recreator Exposure Frequency - (days/year) 75 Reasonable estimate. See 4.7.3 EFrec-a Recreator Exposure Frequency - adult (days/year) 75 Reasonable estimate. See 4.7.3 EFrec-c Recreator Exposure Frequency - child (days/year) 75 Reasonable estimate. See 4.7.3 EDrec Recreator Exposure Duration (years) 26 U.S. EPA 2011a, Table 16-108; 90th percentile or current residence time. EDrec-a Recreator Exposure Duration - adult (years) 20 EDres (26 years) - EDres-c (6 years) EDrec-c Recreator Exposure Duration - child (years) 6 U.S. EPA 1991a, Pages 6 and 15 ETrec Recreator Exposure Time (hours/day) 1 Reasonable estimate. See 4.7.3 ETrec-a Recreator Exposure Time - adult (hours/day) 1 Reasonable estimate. See 4.7.3 ETrec-c Recreator Exposure Time - child (hours/day) 1 Reasonable estimate. See 4.7.3 Table 22. Resident Fish Consumption
Symbol Definition (units) Default Reference CDIres-fsh-ing Resident Fish Radionuclide (pCi) Contaminant-specific Determined in this calculator CDIres-fshw-ing Resident Surface Water Fish Radionuclide (pCi) Contaminant-specific Determined in this calculator BCF Fish Transfer Factor (L/kg) Radionuclide-specific Hierarchy selection in Section 2.3.2 IRFres Resident Fish Ingestion Rate (g/day) 54 U.S. EPA 1991a (page 15) EFres Resident Exposure Frequency - (days/year) 350 U.S. EPA 1991a (pg. 15) EDres Resident Exposure Duration (years) 26 U.S. EPA 2011a, Table 16-108; 90th percentile or current residence time. Table 23. Recreator Game and Fowl Consumption
Symbol Definition (units) Default Reference CDIrec-fowl-ing Recreator Fowl Radionuclide Ingestion (pCi) Contaminant-specific Determined in this calculator CDIrec-game-ing Recreator Game Radionuclide Ingestion (pCi) Contaminant-specific Determined in this calculator CFrec-game Game Contaminated Fraction - farmer (unitless) 1 Developed for Radionuclide Soil Screening calculator CFrec-fowl Fowl Contaminated Fraction - farmer (unitless) 1 Developed for Radionuclide Soil Screening calculator EFrec Recreator Exposure Frequency - (days/year) Site-specific Site-specific EDrec Recreator Exposure Duration (years) 26 U.S. EPA 2011a, Table 16-108; 90th percentile or current residence time. IRGLrec-game Recreator Land Game Ingestion Rate (g/day) Site-specific Site-specific IRGFrec-fowl Recreator Fowl Ingestion Rate (g/day) Site-specific Site-specific Table 24. Farmer Direct Ingestion
Symbol Definition (units) Default Reference CDIfar-produce-ing Farmer Produce Radionuclide Ingestion (pCi) Contaminant-specific Determined in this calculator CDIfar-poultry-ing Farmer Poultry Radionuclide Ingestion (pCi) Contaminant-specific Determined in this calculator CDIfar-egg-ing Farmer Egg Radionuclide Ingestion (pCi) Contaminant-specific Determined in this calculator CDIfar-beef-ing Farmer Beef Radionuclide Ingestion (pCi) Contaminant-specific Determined in this calculator CDIfar-dairy-ing Farmer Dairy Radionuclide Ingestion (pCi) Contaminant-specific Determined in this calculator CDIfar-swine-ing Farmer Swine Radionuclide Ingestion (pCi) Contaminant-specific Determined in this calculator CDIfar-fsh-ing Farmer Fish Radionuclide Ingestion (pCi) Contaminant-specific Determined in this calculator CFfar-produce Produce Contaminated Fraction - farmer (unitless) 1 U.S. EPA 1994c. U.S. EPA. 1998. (pg. C-9) CFfar-poultry Poultry Contaminated Fraction - farmer (unitless) 1 Developed for Radionuclide Soil Screening calculator CFfar-egg Egg Contaminated Fraction - Farmer (unitless) 1 Developed for Radionuclide Soil Screening calculator CFfar-beef Beef Contaminated Fraction - farmer (unitless) 1 Developed for Radionuclide Soil Screening calculator CFfar-dairy Dairy Contaminated Fraction - farmer (unitless) 1 Developed for Radionuclide Soil Screening calculator CFfar-swine Swine Contaminated Fraction - farmer (unitless) 1 Developed for Radionuclide Soil Screening calculator CFfar-fish Fish Contaminated Fraction - farmer (unitless) 1 Developed for Radionuclide Soil Screening calculator IFVfar-adj Farmer Vegetable Ingestion Fraction - age-adjusted (g) 1,583,400 Calculated using the age-adjusted intake factors equation IRVfar-a Farmer Vegetable Ingestion Rate - adult (g/day) 125.7 U.S. EPA 2011 (Table 13-10) IRVfar-c Farmer Vegetable Ingestion Rate - child (g/day) 41.7 U.S. EPA 2011 (Table 13-10) IFFfar-adj Farmer Fruit Ingestion Rate - age-adjusted (g) 2,246,930 Calculated using the age-adjusted intake factors equation IRFfar-a Farmer Fruit Ingestion Rate - adult (g/day) 176.8 U.S. EPA 2011 (Table 13-5) IRFfar-c Farmer Fruit Ingestion Rate - child (g/day) 68.1 U.S. EPA 2011 (Table 13-5) IFPfar-adj Farmer Poultry Ingestion Fraction - age-adjusted (g) 1,318,100 Calculated using the age-adjusted intake factors equation IRPfar-a Farmer Poultry Ingestion Rate - adult (g/day) 106.6 U.S. EPA 2011 (Table 13-52) IRPfar-c Farmer Poultry Ingestion Rate - child (g/day) 23.6 U.S. EPA 2011 (Table 13-52) IFEfar-adj Farmer Egg Ingestion Rate - age-adjusted (g) 658,455 Calculated using the age-adjusted intake factors equation IREfar-a Farmer Egg Ingestion Rate - adult (g/day) 53.4 U.S. EPA 2011 (Table 13-40) IREfar-c Farmer Egg Ingestion Rate - child (g/day) 10.95 U.S. EPA 2011 (Table 13-40) IFBfar-adj Farmer Beef Ingestion Fraction - age-adjusted (g) 2,202,410 Calculated using the age-adjusted intake factors equation IRBfar-a Farmer Beef Ingestion Rate - adult (g/day) 178.0 U.S. EPA 2011 (Table 13-33) IRBfar-c Farmer Beef Ingestion Rate - child (g/day) 40.1 U.S. EPA 2011 (Table 13-33) IFDfar-adj Farmer Dairy Ingestion Fraction - age-adjusted (g) 6,036,590 Calculated using the age-adjusted intake factors equation IRDfar-a Farmer Dairy Ingestion Rate - adult (g/day) 445.6 U.S. EPA 2011 (Table 11-4) IRDfar-c Farmer Dairy Ingestion Rate - child (g/day) 349.5 U.S. EPA 2011 (Table 11-4) IFSWfar-adj Farmer Swine Ingestion Fraction - age-adjusted (g) 1,203,860 Calculated using the age-adjusted intake factors equation IRSWfar-a Farmer Swine Ingestion Rate - adult (g/day) 97.9 U.S. EPA 2011 (Table 13-51) IRSWfar-c Farmer Swine Ingestion Rate - child (g/day) 18.5 U.S. EPA 2011 (Table 13-51) IFFIfar-adj Farmer Fish Ingestion Fraction - age-adjusted (g) 1,918,140 Calculated using the age-adjusted intake factors equation IRFIfar-a Farmer Fish Ingestion Rate - adult (g/day) 155.4 U.S. EPA 2011 (Table 13-20) IRFIfar-c Farmer Fish Ingestion Rate - child (g/day) 32.8 U.S. EPA 2011 (Table 13-20) Table 25. Soil to Groundwater SSL Factor Variables
Symbol Definition (units) Default Reference Cw Target soil leachate concentration (pCi/L) Nonzero MCL or RSL × DAF U.S. EPA. 2002 Equation 4-14 DAF Dilution attenuation factor (unitless) 20 (or site-specific) U.S. EPA. 2002 Equation 4-11 EDgw Exposure duration 70 U.S. EPA. 2002 Equation 4-14 I Infiltration Rate (m/year) 0.18 U.S. EPA. 2002 Equation 4-11 L Source length parallel to ground water flow (m) Site-specific U.S. EPA. 2002 Equation 4-11 i Hydraulic gradient (m/m) Site-specific U.S. EPA. 2002 Equation 4-11 K Aquifer hydraulic conductivity (m/year) Site-specific U.S. EPA. 2002 Equation 4-11 θw Water-filled soil porosity (Lwater/Lsoil) 0.3 U.S. EPA. 2002 Equation 4-10 θa Air-filled soil porosity (Lair/Lsoil) = n-θw U.S. EPA. 2002 Equation 4-10 n Total soil porosity(Lpore/Lsoil) = 1-(ρb/ρs) U.S. EPA. 2002 Equation 4-10 ρs Soil particle density (Kg/L) 2.65 U.S. EPA. 2002 Equation 4-10 ρb Dry soil bulk density (kg/L) 1.5 U.S. EPA. 2002 Equation 4-10 Kd soil-water partition coefficient (L/kg) = Koc*foc for organics U.S. EPA. 2002 Equation 4-10 da Aquifer thickness (m) Site-specific U.S. EPA. 2002 Equation 4-10 ds Depth of source (m) Site-specific U.S. EPA. 2002 Equation 4-10 d Mixing zone depth (m) Site-specific U.S. EPA. 2002 Equation 4-12 Table 26. Wind Particulate Emission Factor Variables
Symbol Definition (units) Default Reference PEF Particulate Emission Factor Wind - Minneapolis (m3/kg) 1.36 x 10⁹(region-specific) U.S. EPA 2002 Exhibit D-2 Q/Cwind Inverse of the Mean Concentration at the Center of a 0.5-Acre-Square Source (g/m2-s per kg/m3) 93.77 (region-specific) U.S. EPA 2002 Exhibit D-2 V Fraction of Vegetative Cover (unitless) 0.5 U.S. EPA. 2002 Equation 4-5 Um Mean Annual Wind Speed (m/s) 4.69 U.S. EPA. 2002 Equation 4-5 Ut Equivalent Threshold Value of Wind Speed at 7m (m/s) 11.32 U.S. EPA. 2002 Equation 4-5 F(x) Function Dependent on Um/Ut (unitless) 0.194 U.S. EPA. 2002 Equation 4-5 A Dispersion constant unitless PEF and region-specific U.S. EPA 2002 Exhibit D-2 As Areal extent of the site or contamination (acres) 0.5 (range 0.5 to 500 ) U.S. EPA 2002 Exhibit D-2 B Dispersion constant unitless PEF and region-specific U.S. EPA 2002 Exhibit D-2 C Dispersion constant unitless PEF and region-specific U.S. EPA 2002 Exhibit D-2 Table 27. Mechanical Particulate Emission Factor Variables from Vehicle Traffic
Symbol Definition (units) Default Reference PEFsc Particulate Emission Factor - subchronic (m3/kg) (Site-specific) U.S. EPA 2002 Equation 5-5 Q/Csr Inverse of the ratio of the 1-h geometric mean concentration to the emission flux along a straight road segment bisecting a square site (g/m2-s per kg/m3) 23.02 (for 0.5 acre site) U.S. EPA 2002 Equation 5-5 FD Dispersion correction factor (unitless) 0.185 U.S. EPA 2002 Equation 5-5 T Total time over which construction occurs (s) 7,200,000 U.S. EPA 2002 Equation 5-5 AR Surface area of contaminated road segment (m2) (AR = LR x WR x 0.092903m2 /ft2 ) U.S. EPA 2002 Equation 5-5 LR Length of road segment (ft) Site-specific U.S. EPA 2002 Equation 5-5 WR Width of road segment (ft) 20 U.S. EPA 2002 Equation E-18 W Mean vehicle weight (tons) (Number of cars x tons/car + number of trucks x tons/truck) / total vehicles) U.S. EPA 2002 Equation 5-5 p Number of days with at least 0.01 inches of precipitation (days/year) Site-specific U.S. EPA 2002 Exhibit 5-2 ∑VKT Sum of fleet vehicle kilometers traveled during the exposure duration (km) ∑VKT = total vehicles x distance (km/day) x frequency (weeks/year) x (days/year) U.S. EPA 2002 Equation 5-5 A Dispersion constant unitless 12.9351 U.S. EPA 2002 Equation 5-6 As Areal extent of site surface soil contamination (acres) 0.5 (range 0.5 to 500) U.S. EPA 2002 Equation 5-6 B Dispersion constant unitless 5.7383 U.S. EPA 2002 Equation 5-6 C Dispersion constant unitless 71.7711 U.S. EPA 2002 Equation 5-6 Table 28. Mechanical Particulate Emission Factor Variables from other than Vehicle Traffic
Symbol Definition (units) Default Reference PEF'sc Particulate Emission Factor - subchronic (m3/kg) (Site-specific) U.S. EPA 2002 Equation E-26 Q/Csa Inverse of the ratio of the 1-h geometric mean air concentration and the emission flux at the center of the square emission source (g/m2-s per kg/m3) Site-specific U.S. EPA 2002 Equation E-15 FD Dispersion correction factor (unitless) 0.185 U.S. EPA 2002 Equation E-16 A Dispersion constant unitless 2.4538 U.S. EPA 2002 Equation E-15 B Dispersion constant unitless 17.5660 U.S. EPA 2002 Equation E-15 C Dispersion constant unitless 189.0426 U.S. EPA 2002 Equation E-15 As Areal extent of site surface soil contamination (acres) (range 0.5 to 500) U.S. EPA 2002 Equation E-15 J'T (g/m2-s) Total time-averaged PM10 unit emission flux for construction activities other than traffic on unpaved roads Site-specific U.S. EPA 2002 Equation E-25 MPCwind Unit mass emitted from wind erosion (g) Site-specific U.S. EPA 2002 Equation E-20 V Fraction of Vegetative Cover (unitless) 0 U.S. EPA 2002 Equation E-20 Um Mean Annual Wind Speed (m/s) 4.69 U.S. EPA 2002 Equation E-20 Ut Equivalent Threshold Value of Wind Speed at 7m (m/s) 11.32 U.S. EPA 2002 Equation E-20 F(x) Function Dependent on Um/Ut (unitless) 0.194 U.S. EPA 2002 Equation E-20 Asurf Areal extent of site surface soil contamination (m2) (range 0.5 to 500) U.S. EPA 2002 Equation E-20 ED Exposure duration (years) Site-specific U.S. EPA 2002 Equation E-20 Mexcav Unit mass emitted from excavation soil dumping (g) Site-specific U.S. EPA 2002 Equation E-21 0.35 PM10 particle size multiplier (unitless) 0.35 U.S. EPA 2002 Equation E-21 Um Mean annual wind speed during construction (m/s) 4.69 U.S. EPA 2002 Equation E-21 Mm-excav Gravimetric soil moisture content (%) 12 (mean value for municipal landfill cover) U.S. EPA 2002 Equation E-21 ρsoil In situ soil density (includes water) (Mg/m3) 1.68 U.S. EPA 2002 Equation E-21 Aexcav Areal extent of excavation (m2) (range 0.5 to 500) U.S. EPA 2002 Equation E-21 dexcav Average depth of excavation (m) Site-specific U.S. EPA 2002 Equation E-21 NA-dump Number of times soil is dumped (unitless) 2 U.S. EPA 2002 Equation E-21 Mdoz Unit mass emitted from dozing operations (g) Site-specific U.S. EPA 2002 Equation E-22 0.75 PM10 scaling factor (unitless) 0.75 U.S. EPA 2002 Equation E-22 sdoz Soil silt content (%) 6.9 U.S. EPA 2002 Equation E-22 Mm-doz Gravimetric soil moisture content (%) 7.9 (mean value for overburden) U.S. EPA 2002 Equation E-22 ∑VKTdoz Sum of dozing kilometers traveled (km) Site-specific U.S. EPA 2002 Equation E-22 Sdoz Average dozing speed (kph) 11.4 (mean value for graders) U.S. EPA 2002 Equation E-22 NA-doz Number of times site is dozed (unitless) Site-specific U.S. EPA 2002 Equation E-22 Bd Dozer blade length (m) Site-specific U.S. EPA 2002 Page E-28 Mgrade Unit mass emitted from grading operations (g) Site-specific U.S. EPA 2002 Equation E-23 0.60 PM10 scaling factor (unitless) 0.60 U.S. EPA 2002 Equation E-23 ∑VKTgrade Sum of grading kilometers traveled (km) U.S. EPA 2002 Equation E-23 Sgrade Average grading speed (kph) 11.4 (mean value for graders) U.S. EPA 2002 Equation E-23 NA-grade Number of times site is graded (unitless) Site-specific U.S. EPA 2002 Equation E-23 Bg Grader blade length (m) Site-specific U.S. EPA 2002 Page E-28 Mtill Unit mass emitted from tilling operations (g) Site-specific U.S. EPA 2002 Equation E-24 still Soil silt content (%) 18 U.S. EPA 2002 Equation E-24 Ac-till Areal extent of tilling (acres) Site-specific U.S. EPA 2002 Equation E-24 Ac-grade Areal extent of grading (acres) Site-specific Necessary to solve ∑VKTgrade in U.S. EPA 2002 Equation E-23 Ac-doz Areal extent of dozing (acres) Site-specific Necessary to solve ∑VKTdoz in U.S. EPA 2002 Equation E-22 NA-till Number of times soil is tilled (unitless) 2 U.S. EPA 2002 Equation E-24
6. References
ANL 1993. Manual for Implementing Residual Radioactive Materials Guidelines Using RESRAD, Version 5.0. Argonne National Laboratory, Argonne, IL. ANL/EAD/LD-2
Calabrese E.J., Barnes R., Stanek III E.J., Pastides H., Gilbert CE, Veneman P., Wang XR, Lasztity A., and Kostecki P.T. How much soil do young children ingest: an epidemiologic study. Regul Toxicol Pharmacol 1989: 10(2):123-137.
Davis, S; Waller, P; Buschbom, R; Ballou, J; White, P. (1990). Quantitative estimates of soil ingestion in normal children between the ages of 2 and 7 years: Population-based estimates using aluminum, silicon, and titanium as soil tracer elements. Arch Environ Health 45: 112-122.
Etnier 1980. Till, J. E., H. R. Meyer, E. L. Etnier, E. S. Bomar, R. D. Gentry, G. G. Killough, P. S. Rohwer, V. J. Tennery, and C. C. Travis Tritium-An Analysis of Key Environmental and Dosimetric Questions. ORNL/TM-6990. pg 15.
Hinton, T. G. 1992. Contamination of plants by resuspension: a review, with critique of measurement methods. Sci. Total Environ. 121:171-193
IAEA 1994. Handbook of Parameter Values for the Prediction of Radionuclide Transfer in Temperate Environments. International Atomic Energy Agency
ICRP 2008. Nuclear Decay Data for Dosimetric Calculations. ICRP Publication 107. Ann. ICRP 38 (3).
MILLER Ch. W. (1980): An analysis of measured values for the fraction of a radiocative aerosol intercepted by vegetation. Health Physics, 38: 705 - 712.
NEC. Swine Nutrition Guide. Cooperative Extension Service / South Dakota State University and University of Nebraska / U.S. Department of Agriculture. Nebraska Cooperative Extension EC 95-273-C.
The pig water ingestion numbers are derived from the USDA "Swine Nutrition Guide" and the EPA Human Health Risk Assessment Protocol for Hazardous Waste Combustion Facilities, found here. USDA assumes a pig consumes 1/4 to 1/3 gallons of water for every pound of dry feed. The midpoint of this range (7/24 gallons of water per 1 lbs. of dry feed) was used with the default dry feed, (4.7 kg) from the U.S. EPA, to come up with 3 gallons (11.4 L) per day default water intake.
NCRP 1996. Screening Models for Releases of Radionuclides to Atmosphere, Surface Water, and Ground, Vols. 1 and 2, NCRP Report No. 123. National Council on Radiation Protection and Measurements. https://ncrponline.org/publications/reports/ncrp-reports-123/
NRC 1994. Nutrient Requirements of Poultry: Ninth Revised Edition, 1994. Washington, DC: The National Academies Press, 1994.
ORNL 2014a. Area Correction Factors for Contaminated Soil for Use in Risk and Dose Assessment Models and appendix. Center for Radiation Protection Knowledge. September 2014.
ORNL 2014b. Gamma Shielding Factors for Soil Covered Contamination for Use in Risk and Dose Assessment Models and appendix. Center for Radiation Protection Knowledge. September 2014.
ORNL 2014c. Calculation of Slope Factors and Dose Coefficients and appendix. Center for Radiation Protection Knowledge. September 2014.
U.S. EPA 1988. U.S. Environmental Protection Agency (U.S. EPA). Superfund Exposure Assessment Manual (SEAM). Office of Solid Waste and Emergency Response. OSWER Directive 9285.5-1. EPA/540/1-881001.
U.S. EPA 1989. U.S. Environmental Protection Agency (U.S. EPA). Risk assessment guidance for Superfund. Volume I: Human health evaluation manual (Part A). Interim Final. Office of Emergency and Remedial Response. EPA/540/1-89/002.
U.S. EPA 1990. Interim Final Methodology for Assessing Health Risks Associated with Indirect Exposure to Combustor Emissions. Environmental Criteria and Assessment Office. ORD. EPA-600-90-003. January.
U.S. EPA 1991a. U.S. Environmental Protection Agency (U.S. EPA). Human health evaluation manual, supplemental guidance: "Standard default exposure factors". OSWER Directive 9285.6-03.
U.S. EPA 1991b. Risk Assessment Guidance for Superfund, Volume I: Human Health Evaluation Manual (Part B, Development of Risk-Based Preliminary Remediation Goals). Office of Emergency and Remedial Response. EPA/540/R-92/003. December 1991
U.S. EPA. 1993. External Exposure to Radionuclides in Air, Water, and Soil. Federal Guidance Report No. 12. Office of Radiation and Indoor Air, Washington, DC. EPA 402-R-93-081. https://www.epa.gov/sites/default/files/2015-05/documents/402-r-93-081.pdf
U.S. EPA. 1994a. Estimating Exposure to Dioxin-like Components - Volume III: Site-Specific Assessment Procedure. Review Draft. Office of Research and Development. Washington D.C. EPA/600/6-88/005Cc. June. (Also see U.S. EPA. 1994c for direct link to Table) http://cfpub.epa.gov/ncea/cfm/recordisplay.cfm?deid=34762
U.S. EPA 1994b. Radiation Site Cleanup Regulations: Technical Support Documents for the Development of Radiation Cleanup Levels for Soil - Review Draft. Office of Radiation and Indoor Air, Washington, DC. EPA 402-R-96-011A. PDF document View Appendix C here.
U.S. EPA. 1994c. Revised Draft Guidance for Performing Screening Level Risk Analyses at Combustion Facilities Burning Hazardous Wastes. Attachment C, Draft Exposure Assessment Guidance for RCRA Hazardous Waste Combustion Facilities. Office of Emergency and Remedial Response. Office of Solid Waste. December 14. https://rais.ornl.gov/documents/OSWER_PX_175.pdf
U.S. EPA. 1996a. Soil Screening Guidance: User's Guide. Office of Emergency and Remedial Response. Washington, DC. OSWER No. 9355.4-23 /documents/SoilScreeningUsersGuide1996.pdf
U.S. EPA. 1996b. Soil Screening Guidance: Technical Background Document. Office of Emergency and Remedial Response. Washington, DC. OSWER No. 9355.4-17A Soil Screening Guidance Technical Background Document.pdf
U.S. EPA. 1997a. Exposure Factors Handbook. Office of Research and Development, Washington, DC. EPA/600/P-95/002Fa.
U.S. EPA. 1997b. Parameter Guidance Document. National Center for Environmental Assessment, NCEA-0238.
U.S. EPA. 1998. Human Health Risk Assessment Protocol for Hazardous Waste Combustion Facilities. Office of Solid Waste, Washington, DC. EPA530-D-98-001A. A secure PDF can be downloaded here.
U.S. EPA. 1999a. Data Collection for the Hazardous Waste Identification Rule. Office of Solid Waste, Washington, DC. https://epa-dccs.ornl.gov/documents/dataHWIR.pdf The section on cattle fodder, soil and water intakes is here.
U.S. EPA 1999b. Volume II, "Review of Geochemistry and Available Kd Values for Cadmium, Cesium, Chromium, Lead, Plutonium, Radon, Strontium, Thorium, Tritium (3H), and Uranium. Office of Radiation and Indoor Air. Washington, DC. EPA 402-R-99-004B, August 1999. http://www.epa.gov/cgi-bin/claritgw?op-Display&document=clserv:OAR:0232;&rank=4&template=epa
U.S. EPA 1999c. Cancer Risk Coefficients for Environmental Exposure to Radionuclides. Federal Guidance Report No. 13. Office of Radiation and Indoor Air. EPA 402-R-99-001. September 1999. https://www.epa.gov/system/files/documents/2025-03/402-r-99-001_508-d_2.pdf
U.S. EPA. 2000a. Soil Screening Guidance for Radionuclides: User's Guide. Office of Emergency and Remedial Response and Office of Radiation and Indoor Air. Washington, DC. OSWER No. 9355.4-16A https://rais.ornl.gov/documents/SSG_rad_user.pdf
U.S. EPA. 2000b. Soil Screening Guidance for Radionuclides: Technical Background Document. Office of Emergency and Remedial Response and Office of Radiation and Indoor Air. Washington, DC. OSWER No. 9355.4-16 Soil Screening Guidance Technical Background Document.pdf
U.S. EPA 2002. Role of Background in the CERCLA Cleanup Program. Office of Solid Waste and Emergency Response, April 26, 2002, OSWER 9285.6-07P
U.S. EPA 2002. Supplemental Guidance for Developing Soil Screening Levels for Superfund Sites. OSWER 9355.4-24. December 2002. https://www.epa.gov/superfund/superfund-soil-screening-guidance
U.S. EPA 2002. Simulating Transport in the Unsaturated Zone: Evaluation and Sensitivity Analyses of Select Computer Models.
U.S. EPA 2004. Risk Assessment Guidance for Superfund Volume I: Human Health Evaluation Manual (Part E, Supplemental Guidance for Dermal Risk Assessment) Final. OSWER 9285.7-02EP.July 2004.
U.S. EPA. 2005. Human Health Risk Assessment Protocol for Hazardous Waste Combustion Facilities. Office of Solid Waste, Washington, DC. 2005 HHRAP. The pdf is available here.
U.S. EPA. 2011. Exposure Factors Handbook 2011 Edition (Final). National Center for Environmental Assessment, Office of Research and Development. Washington D.C.
U.S. EPA. 2014. OSWER Directive 9200.1-120 and FAQ. Office of Solid Waste and Emergency Response, Washington, DC.
van Wijnen J.H., Clausing P., and Brunekreef B. Estimated soil ingestion by children. Environ Res 1990: 51(2): 147-162.
Pinder, J. E. ,. I., and K. W. McLeod. 1989. Mass loading of soil particles on plant surfaces, Health Phys. 57:935-942.
U.S. EPA. 2018. Region 4 Human Health Risk Assessment Supplemental Guidance. EPA Region 4. March, 2018.
U.S. EPA. 2019. Exposure Factors Handbook Chapter 3 Updates. Office of Research and Development, Washington, DC. EPA/600/R-090/052F
