Using The RAIS
- Module 1 » Introduction
- Module 2 » Chemical Tools: Data Screening to Determine COPCs
- Module 3 » Chemical Tools: Adult Lead Model
- Module 4 » Chemical Tools: Media Transport Tools
- Module 5 » Chemical Tools: Toxicity Assessment
- Module 6 » Chemical Tools: Risk Characterization
- Module 7 » Radionuclide Tools: Data Screening to Determine COPCs
- Module 8 » Radionuclide Tools: Media Transport Tools
- Module 9 » Radionuclide Tools: Toxicity Assessment
- Module 10 » Radionuclide Tools: Risk Characterization
- Module 11 » Documentation/References
Click here for a graphical representation of the Tutorial modules.
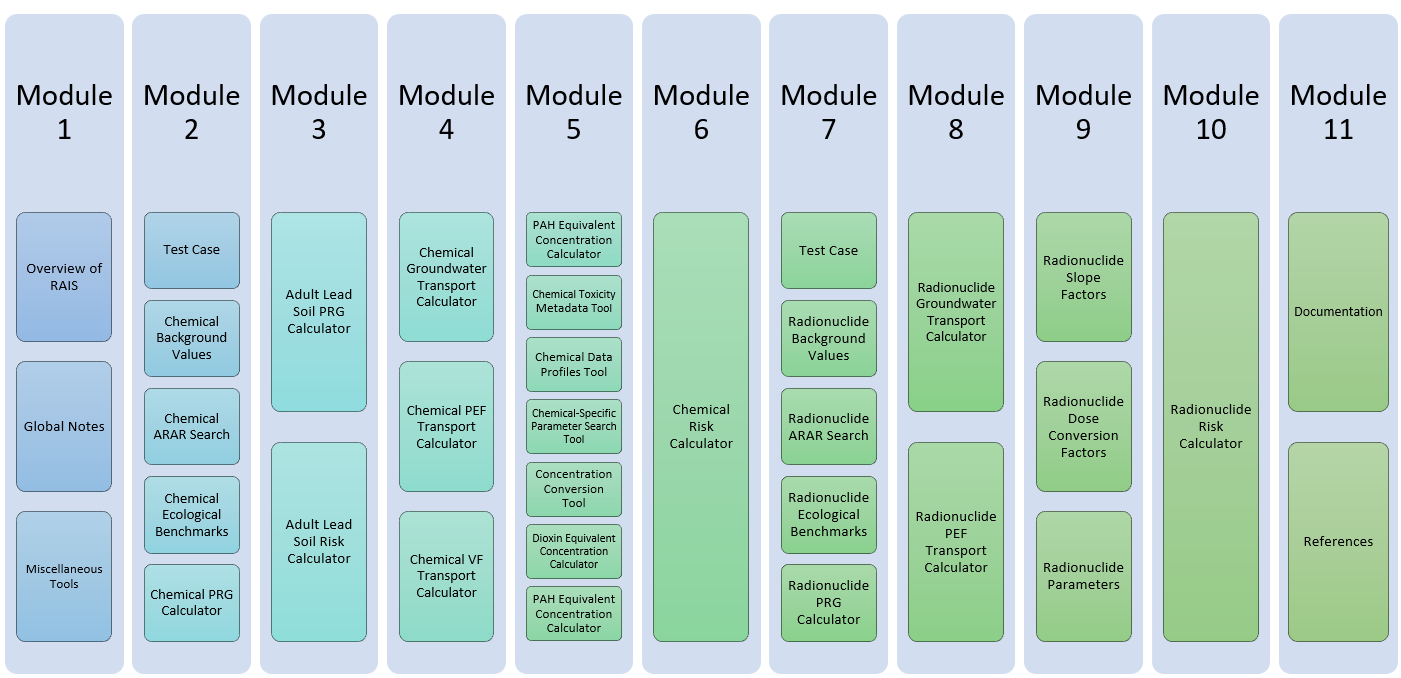
MODULE #1: Introduction
Overview of RAIS
The Risk Assessment Information System (RAIS) disseminates risk tools and supplies information for risk assessment activities. Taking advantage of searchable and executable databases, menu-driven queries, and data downloads using the latest Web technologies, the RAIS offers essential tools and information for the risk assessment process. The RAIS is applicable to diverse users, as most tools can be tailored to meet site-specific needs. More information about the RAIS can be found in the 2023 technical memorandum available here.
This tutorial is designed to assist the user in understanding and applying available RAIS tools to the risk assessment process. You will be guided through a focused case study that will demonstrate how to utilize many of the tools and information available on the RAIS. Specifically, this tutorial will assist in:
- Determining appropriate preliminary remediation goals (PRGs) for screening/comparisons,
- Identifying and selecting the chemicals of potential concern (COPCs),
- Extracting information for a toxicity assessment,
- Calculating risk/hazards, and
- Documenting portions of the risk assessment report.
Before beginning this tutorial, a brief overview of risk assessment is provided in the mini tutorial What is Risk Assessment? Additional risk assessment guidance can be found using the links under the Guidance dropdown.
For more hands-on guidance, the RAIS team offers training courses with guided practice sessions. Information on upcoming training can be found here or by selecting the training icon on the RAIS ![]() .
.
The RAIS system undergoes frequent changes to keep all its information up to date. Users can review changes on the What’s New page or subscribe to receive email updates here.
Global Notes
There are a few notes to keep in mind when using the RAIS:
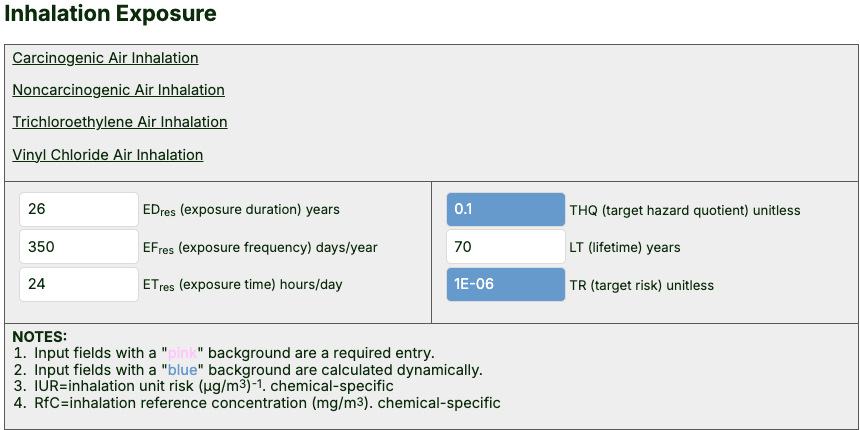
- When running calculators in site-specific mode, the values in white cells can usually be modified while blue cells often show values that are locked or calculated dynamically and cannot be modified. For example, see the Inhalation Exposure calculation below.
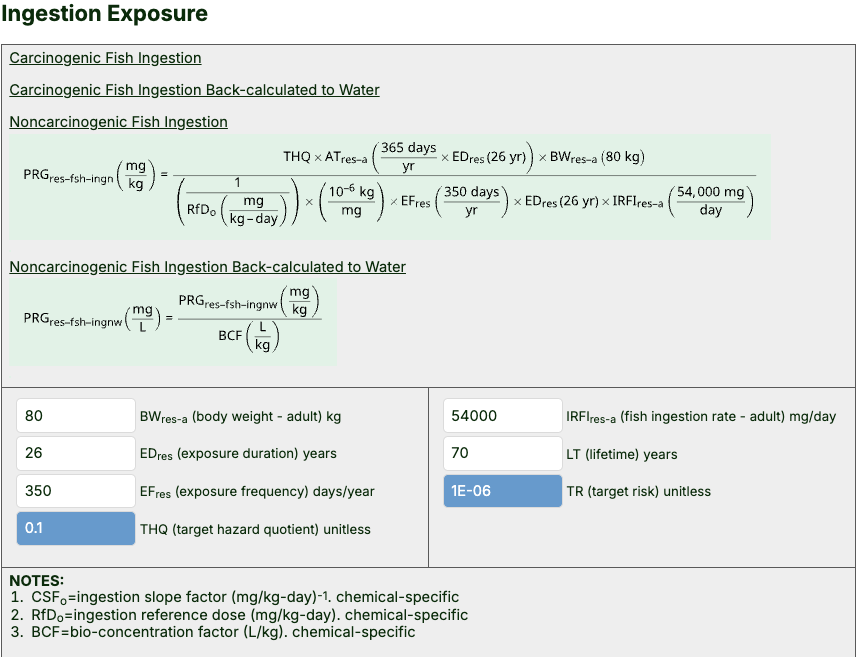
- Most blue text provides hyperlinks to images or equations. For example, the following image shows hyperlinks to equation images when running the calculators in site-specific mode. Click on the equation label (blue text) to view the entire equation image.
- The RAIS provides brief instructions for several tools called “mini-guides”, indicated with bold text at the top of the tool. Click this link to view the instructions.

- Footnotes are available for many calculator results. Click these blue numbers (circled in red on image) to view the footnotes.

- All equations used in the RAIS PRG and Risk Calculators (for Chemicals and Radionuclides) are listed by exposure pathway in Section 4 of the applicable user guide, and equation variables are defined and listed by exposure pathway in Section 6 of the applicable user guide.
- Make sure to notice the calculation date for calculator output images in this tutorial, as some information (e.g., toxicity values) may have changed since the calculation was performed.
- the RAIS contact feature at the bottom of each page
- the Support link on the upper right of each page

- the Staff Listing pages available at the bottom of each page or through the following link at the top right of each page

Miscellaneous Tools
Document Search

The RAIS Document Search tool allows users to search for
risk assessment guidance, chemical or radionuclide-specific information, results from previous investigations, and more.
Glossary

The RAIS Glossary includes environmental restoration terms with definitions from DOE-ORO Environmental Restoration/Waste Management
Risk Assessment Program staff and affiliates and other sources.
What’s New page

Changes to toxicity values, physicochemical parameters, ecological screening benchmarks, and ARARs are generally updated
throughout the year with a focus on the semiannual updates in May and November. The What’s New page provides monthly updates as far back as February 1996. A key benefit of this feature is to inform users of updates that may
impact ongoing risk assessments (e.g., revised toxicity values).
User Support
General questions may be submitted through:
For additional guidance, see a list of commonly asked questions from users on the Frequently Asked Questions page (also available by selecting the following link at the top right of each page.
MODULE #2: Chemical Tools: Data Screening to Determine COPCs
The following hypothetical example is presented to illustrate how the RAIS tools are used in a chemical risk assessment.
Chemical Test Case
An industrial area upstream of Site A has accidentally released contaminants into the nearby stream. This stream is classified for domestic, fish and aquatic life, recreational, and irrigation uses. At Site A, there is a residential community that uses the stream for domestic household uses; they also occasionally catch and eat the fish from this stream. Surface water and fish samples were taken from the stream at Site A, and the results of the chemical analyses are provided in the data set below for use in this example.
Table 1. Example Data Set for Site A:
| Analyte | CASRN | Detection Frequency |
Maximum Detected Concentration |
Units | Detection Medium |
|---|---|---|---|---|---|
| Arsenic | 7440-38-2 | 3/4 | 1.3 | µg/L | Surface Water |
| Carbon tetrachloride | 56-23-5 | 4/4 | 0.85 | mg/kg | Fish |
| Toluene | 108-88-3 | 2/4 | 4.3 | µg/L | Surface Water |
| Trichloroethane, 1,1,1- | 71-55-6 | 2/4 | 12,600 | µg/L | Surface Water |
Chemical Background Values
Guidance for comparing background data to site-related contaminant data is provided in the Guidance for Conducting Risk Assessments and Related Risk Activities for the DOE-ORO Environmental Management Program (BJC/OR-271), Appendix C. This background comparison guidance has been consistently used for the Oak Ridge Reservation; however, you should consult with your Regional Program Manager and appropriate Stakeholders before the background screen is performed to determine the appropriate method for your site.
The RAIS contains four options for background screening:
- Generic: generic soil background values for selected non-radionuclide chemicals
- Oak Ridge: site-specific background values from a Background Soil Characterization Project done at the Oak Ridge Reservation in 1993
- Portsmouth: site-specific background values for selected inorganic and organic chemicals in soil and groundwater at the Portsmouth Gaseous Diffusion Plant
- Paducah: site-specific background values for naturally occurring inorganic chemicals and selected radionuclides in soil (surface and subsurface) and groundwater (filtered and unfiltered) at the Paducah Gaseous Diffusion Plant
Obtaining Generic Chemical Background Values
- Select “Background Values” from the Chemical Tools menu; then select “Generic Background Values”.

- There is an option to enter the title of your project for the downloadable XLSX of output values.

- Select Individual Chemicals from the “available” box .
- Click “Retrieve”.
- On the Results page, click “Output to XLSX” to download the data as an .xlsl file or “New Search” to start a new search.

Obtaining Site-Specific Chemical Background Values
USelect “Background Values” from the Chemical Tools menu; then select "Oak Ridge Background", “Portsmouth Background”, or “Paducah Background”. The Results page will either display a table(s) of background values or references/links to background source documents.
Chemical ARAR Search
Before performing an ARARs screen, be sure to check with your regulators (e.g., EPA Region IV does not perform the ARARs screen as part of the baseline human health risk assessment). Some states may only require that the ARARs for the detected analytes be reported in the remedial investigation report. Risk assessors should consult with appropriate regulatory agencies to determine which, if any, ARARs to screen against and the appropriate selection criteria based on the water body classification.
If you plan to use criteria from any of the 13 states offered in the RAIS ARAR Search tool, check the state webpages for the original sources of the ARARs, in case there have been recent updates. Links to health and environmental agencies for U.S. States and Territories can be found here.
Instructions for Chemical ARAR Screen (Federal Source)
- Choose ARAR Search from the Chemical Tools menu.
- There is an option to enter the title of your project for the downloadable XLSX of output values.

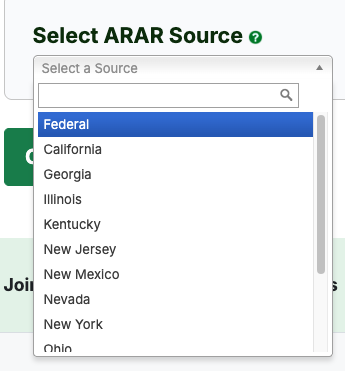
- Under "Select ARAR Source", choose "Federal" or one of 13 states.
- Review the available criteria options and select those applicable to the project. (Click in the checkbox to "Select All" criteria for that group.)
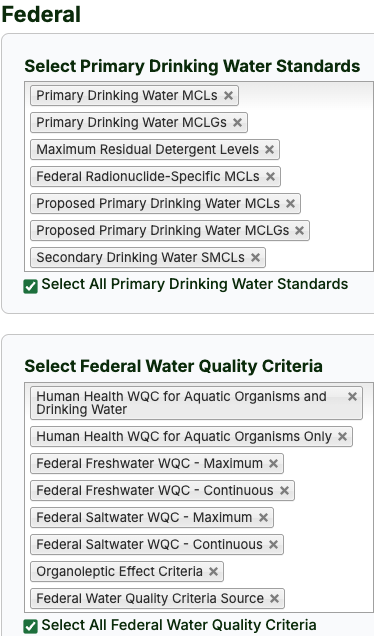
- Select individual chemicals in the “available” (left) box and press the >> button to move the analytes into the “selected” (right) box. (Click in the checkbox to select all chemicals.)
- Press "Retrieve".
- Evaluate the results (make sure to refer to all applicable footnotes) based on appropriate guidance.
- Click “Output to XLSX” to download the data as an .xlsl file or “New Search” to start a new search.

Evaluation of Chemical ARAR Screen Results (Federal Source)
Comparing ARAR results (Table 2) to the data set (Table 1) shows that the maximum detected concentration for toluene is below the ARAR, therefore we could eliminate toluene from further risk assessment steps. However, for the purposes of this tutorial and because of state guidance variance that may require ARAR comparisons be performed at a different stage in the remedial investigation process, we will assume that none of the contaminants are screened out at this stage.
Table 2: Chemical ARAR Screen Federal Source
| Analyte | CASRN | Primary Drinking Water MCLs (µg/L) | Primary Drinking Water MCLGs (µg/L) | Proposed Primary Drinking Water MCLs (µg/L) | Proposed Primary Drinking Water MCLGs (µg/L) | Secondary Drinking Water SMCLs (µg/L) |
|---|---|---|---|---|---|---|
| Arsenic, Inorganic | 7440-38-2 | 10 | 0 | |||
| Carbon Tetrachloride | 56-23-5 | 5 | 0 | |||
| Toluene | 108-88-3 | 1000 | 1000 | |||
| Trichloroethane, 1,1,1- | 71-55-6 | 200 | 200 |
Table 2: Chemical ARAR Screen Federal Source (cont.)
| Analyte | CASRN | Human Health WQC for Aquatic Organisms and Drinking Water (µg/L) | Human Health WQC for Aquatic Organisms Only (µg/L) | Federal Freshwater WQC - Maximum (µg/L) | Federal Freshwater WQC - Continuous (µg/L) |
|---|---|---|---|---|---|
| Arsenic, Inorganic | 7440-38-2 | 0.018 | 0.14 | 340 | 150 |
| Carbon Tetrachloride | 56-23-5 | 0.23 | 1.6 | ||
| Toluene | 108-88-3 | 1300 | 15000 | ||
| Trichloroethane, 1,1,1- | 71-55-6 |
Chemical Ecological Benchmarks
Because the risk-based PRGs in the database were developed to protect human health, they may not be adequately protective of nonhuman receptors. For sites where risk-based PRGs for ecological receptors are required, the RAIS provides the ecological benchmarks tool and the ecological benchmark user guide.
Obtaining Chemical Ecological Benchmarks
- Choose “Benchmarks for Chemicals" from the Ecological Tools menu.
- There is an option to enter the title of your project for the downloadable XLSX of output values.

- Select individual benchmark sources (or Select All by clicking the checkbox below the dropdown). Sources include various EPA regions, individual states, and countries.
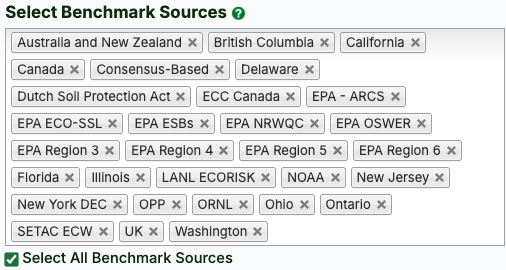
- Select media options (or Select All by clicking the checkbox below the dropdown). There are 5 available media options: air, biota, sediment, soil, and surface water.
- Select chemicals of interest from the “available” box.
- Click the “Retrieve” button.
- The Results page shows the available ecological benchmarks by media (or a message if there are no ecological benchmarks for the selected chemicals for that media).

- To download data to an .xlsx format, scroll to the bottom of the last table of benchmarks and click the “Output to XLSX” button.
- References for all benchmark sources and the list of all available footnotes are provided under the Results tables.
Chemical PRG Calculator
After screening against ARARs, the next step is to screen the data from Table 1 against the risk-based Preliminary Remediation Goals (PRGs). To learn more about PRGs, refer to the Chemical PRG Calculator User Guide, which presents specific PRG Equations for each land use. PRGs can be calculated using the Chemical PRG Calculator, available under the Chemical Tools menu.
As a reminder, we will generate PRGs based on an example hypothetical situation concerning a stream at Site A contaminated with arsenic, carbon tetrachloride, toluene, and 1,1,1-trichloroethane. Nearby residents drink water and eat fish from the stream. Surface water and fish samples have been collected for a baseline risk assessment.
Using the Chemical PRG Calculator
Please note that the session inputs for the PRG calculator can be saved for future use and recalled by the PRG calculator. Instructions for saving the session inputs and accessing them later are included in this section.
- Choose "PRG Calculator" from the Chemical Tools menu.
- There is an option to enter the title of your project for the downloadable XLSX of output values.

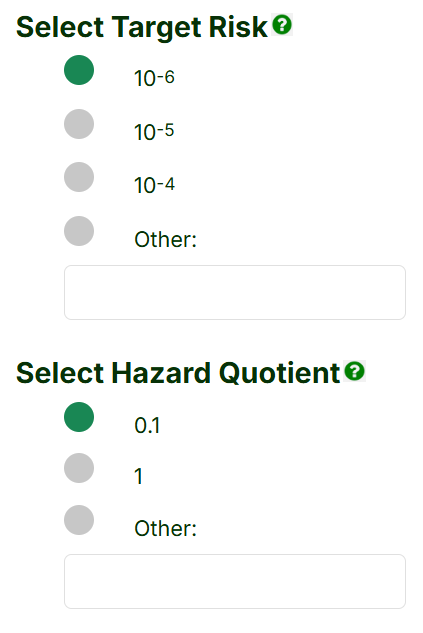
- Select the Target Risk (10-6 for this example) and Target Hazard Quotient (1 for this example).
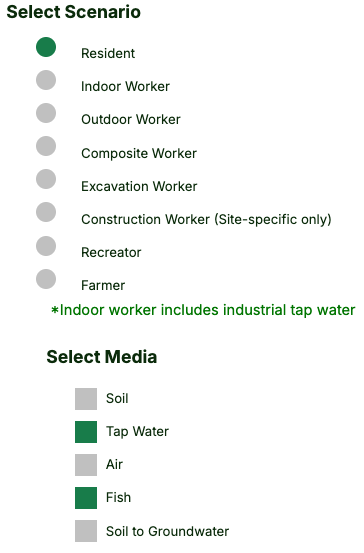
- Select the Scenario and Media. (For this example, select Resident (the receptor group of concern). For media, select Tap Water rather than Surface Water, because the residents at Site A are using the water for household purposes. Select Fish, as the residents are eating fish caught from the stream.)
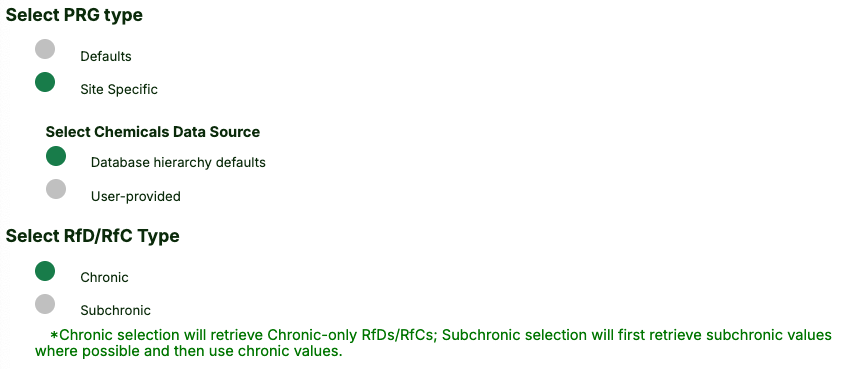
- Select PRG Type.
- "Defaults" uses the default toxicity values and parameters for the PRGs.
- If "Site-Specific" is selected, the Chemical Data Source menu will appear with two options: 1) "Database hierarchy of defaults" uses the default toxicity values and chemical-specific parameters (see sections 2.3 and 2.4 of the PRG User Guide) but allows users to alter equation parameters and 2) "User-provided" allows users to review/alter the toxicity values and chemical-specific parameters as well as equation parameters.
- Note: the RAIS will only provide the option to save your settings for a future run if either "Site-Specific" mode is selected.
- For this example, select "Site-Specific", "Database hierarchy defaults".
- Select the RfD/RfC Type. Chronic toxicity values are developed to be protective for long-term exposures (generally greater than 7 years). Subchronic toxicity values are used for short-term exposures. For this example, select Chronic.
- Select Chemicals of Interest by typing the name into the box (for this example the four analytes identified below) and
click the desired analytes to select them.

- You may also select all.

- Click Retrieve.
- If "Site-Specific" mode was selected, review/adjust all equation parameters, as needed (for "user-provided", also review/adjust the chemical toxicity values and chemical-specific parameters). For this example, do not alter any parameters.
- Click Retrieve to see results.
- If you do not want to save your work for a future run, proceed to the next step. Otherwise, follow the instructions below.
- At the top of the Results page, click “Yes” if you would like to save your work for a future run, enter your email (optional), and then click the “Save” button.

- A file number will be generated that should be used in the future to access all settings you used for this run.
If you chose to enter your email address earlier, this information will be sent to you in an email.

- To access your saved settings in a new run, go to the Chemical PRG Calculator page and click “Yes” in the box at the top that says “Do you have a previously saved file?”;
then enter the file number. For the second question, selecting yes will redo the PRG run with the
same chemicals and chemical information types used previously.

- Click the “Retrieve Parameters” button to bypass the first page and go directly to the second calculator page where the site-specific inputs can be made. If we had made site-specific changes to the exposure parameters, these would be replicated here.
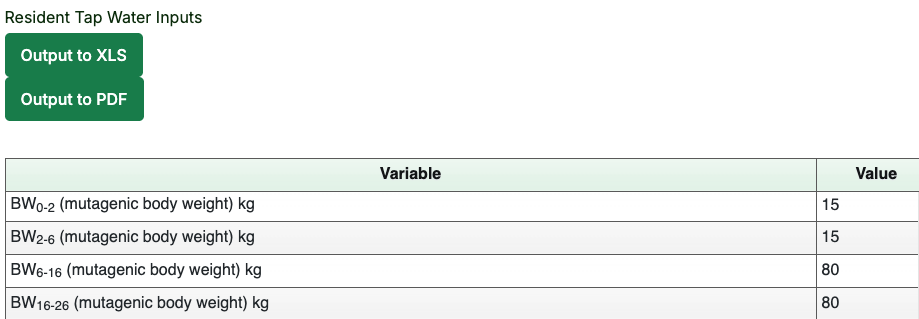
- Results are presented by media. The first table for each media will be the table of inputs. This page allows default values to be compared against user-entered site-specific values. In the following image, no site-specific values were entered, so the column values are the same.
- The second result table for each media is the table of PRGs. These tables also provide the toxicity values (with sources) used to calculate the PRGs. Check theses sources to ensure they are acceptable to local authorities.
Evaluation of Chemical PRG Calculator Results
In the case of our hypothetical stream contamination situation, our next step for the baseline risk assessment would be to select the most protective (lowest value) of the cancer and noncancer PRGs for screening. The selected PRGs would then be compared against the relevant maximum detected analyte concentrations from Site A in Table 1.
The PRG results for the tap water and fish exposure mediums are listed in the two tables below, with orange shading indicating the selected (most protective) PRG (Tables 3 and 4). Calculations were performed on July 11, 2023.
Table 3: Resident Chemical Preliminary Remediation Goals for Tap Water
Table 4: Resident Chemical Preliminary Remediation Goals for Fish
As seen in Table 4, the fish exposure medium automatically generates two sets of PRGs: one for the fish concentration and one for surface water concentration associated with fish ingestion. No surface water samples associated with fish ingestion samples were collected in our example scenario, therefore the Surface Water-Fish PRGs will not be used.
Using the Site A data set (Table 1), the maximum detected concentrations (MDC) for surface water for each analyte are compared against the selected tap water PRGs; the MDCs for fish for each analyte are compared against the fish PRGs. For sample concentrations that are below the PRGs, those contaminants do not need to be carried forward in the baseline risk assessment. Otherwise, the analytes would be considered COPCs. The summary of the PRG screening is shown in Table 5, where pink-shading indicates that the maximum detected concentration exceeds the PRG. As can be seen in Table 5, all analytes except toluene will be considered COPCs and will move forward in the baseline risk assessment, where risks will be calculated for the residents at Site A.
Table 5: Comparison of Chemnical Sample Data to PRGs
MODULE #3: Chemical Tools: Adult Lead Model
The RAIS includes two methods for assessing risks associated with non-residential exposures to lead and soil: the Adult Lead Model (ALM) risk calculator and the ALM PRG calculator. The methodology focuses on estimating fetal blood lead concentrations in women exposed to lead-contaminated soils. This approach also provides tools for evaluating risks of elevated blood lead concentrations among exposed adults.
Adult Lead Soil PRG Calculator
The Adult Lead Soil PRG Calculator can be used to determine whether lead is present at a level that may pose an unacceptable risk to human health. Review the default exposure parameters used in the calculations, which can be changed if evaluating a site-specific scenario. The PRG will be automatically calculated and shown in the blue cell.
Adult Lead Soil Risk Calculator
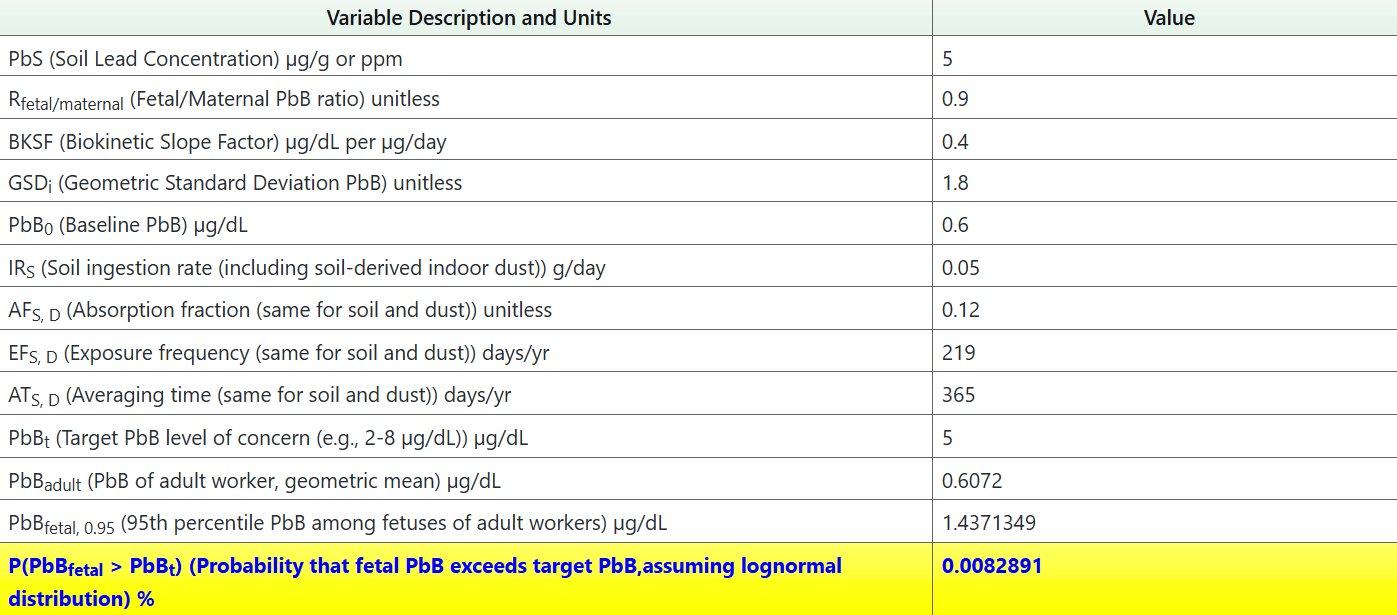
The Adult Lead Soil Risk Calculator calculates the probability (risk) of the fetal blood lead concentration exceeding target blood levels by determining the fetal blood lead level concentration from the user-provided soil lead concentration.
- Enter the soil lead concentration in the box labeled “PbS (Soil Lead Concentration) µg/g or ppm”. The EPA recommends using the average soil lead concentration for the ALM.
- There is an option to enter the title of your project for the downloadable XLSX of output values.

- Review the default exposure parameters used in the calculations, which can be changed if evaluating a site-specific scenario.
- After the soil lead concentration has been added and exposure parameters have been changed (if necessary), the risk will be automatically calculated in the blue cells at the bottom.
- Click the “Retrieve” button for the probability that the fetal PbB exceeds the taret PbB.
- Press "Output to Spreadsheet" or "Output to PDF" to download the results.
MODULE #4: Chemical Tools: Media Transport Tools

Chemical Groundwater Transport Calculator
The Chemical Groundwater Transport Calculator recreates the migration pathway of contaminants from soil to groundwater by calculating the expected groundwater concentration from user-provided soil concentrations. Parameters can be adjusted prior to exporting the results. Unlike other tools on the RAIS, the Chemical Groundwater Transport Calculator only considers the Resident receptor. The Resident is expected to be the most conservative option and therefore protective of other receptors.
For more information on the soil to groundwater pathway, see Section 4.9 of the Chemical Risk Calculator User Guide.
Using for the Chemical Groundwater Transport Calculator
- Select “Media Transport" from the Tools menu; then select “Chemical Groundwater Calculator”.
- There is an option to enter the title of your project for the downloadable XLSX of output values.

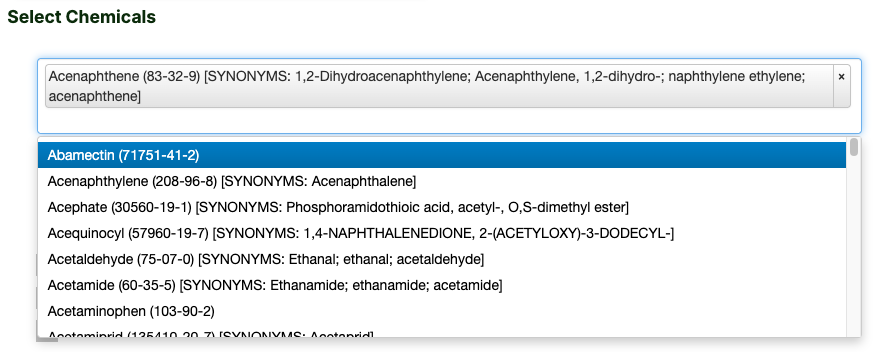
- Select chemicals of interest by typing in the box (note that synonyms and CAS numbers are listed) and pressing enter. Multiple chemicals may be entered.
- Press "Retrieve".
- At the next screen, enter soil concentrations for the selected chemicals.
- Review the “Dilution Factor for Migration to Groundwater Equations and Parameters” section.
- View the equation for the calculation of the Dilution Attenuation Factor (DAF) and the site diagram that shows how soil contaminants can migrate to underlying groundwater by pressing the blue links.
- If applicable, enter a site-specific DAF to replace the default DAF value (1).

- The default DAF may also be changed by entering site-specific values for the variables used in the DAF calculation; the calculator will populate the
blue DAF box in the “Migration to Groundwater” section with the revised value.
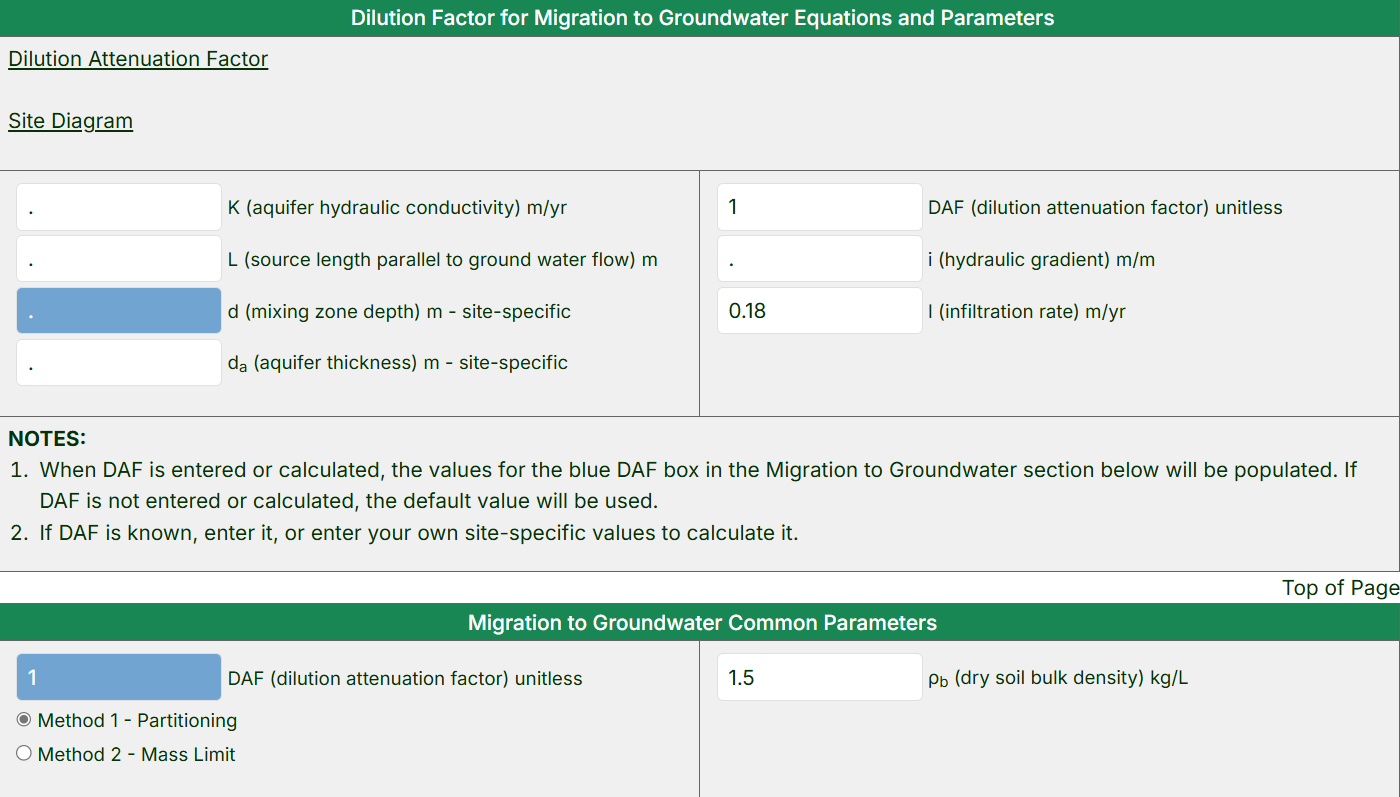
- By default, the RAIS calculator will show the equation and parameters for “Method 1 – Partitioning”. Select the “Method 2 – Mass Limit” to use a different equation and parameters.

- After completing the review of the equations and parameters and making any necessary edits, click the “Retrieve” button to obtain the results or click the “Clear” button to start over.
- The Results page presents the “Migration to Groundwater Inputs” table, where any site-specific values used will be displayed alongside the default values, and the results table (example below) with soil concentration(s) for the associated tap water concentration(s).

Chemical PEF Transport Calculator
There are multiple types of PEFs that can be calculated based on the exposure scenario at hand. The Chemical PEF Transport Calculator guides the user through the calculation of the following PEFs:
- PEF Wind-Driven (PEF)
- Subchronic PEF Mechanically Driven – Unpaved Road Traffic (PEFsc)
- Subchronic PEF Mechanically Driven – Other Construction Activities (PEF’sc)
- Mechanical Particulate Emission Factor for Off-site Receptors (Standard Vehicle Traffic) (PEFoff)
- Mechanical Particulate Emission Factor for Off-site Receptors (Other Construction Activities) (PEF’off)
For more information on these PEF types, see sections 4.10.1 through 4.10.3 of the Chemical Risk Calculator User Guide.
Using for the Chemical PEF Transport Calculator:
- Select “Media Transport" from the Tools menu; then select “PEF Calculator”.
- There is an option to enter the title of your project for the downloadable XLSX of output values.
 Enter the beginning soil concentration in the left box for chemicals or right box for radionuclides.
- Determine the applicable PEF type. Each of the 5 PEF types will have their own sections, equations, and parameters. (If soil were being evaluated for our hypothetical resident scenario presented in Module 2, the generic PEF (PEF Wind Driven) would be applicable given that construction is complete and the nearby roads are paved. If construction were ongoing, one of the other PEFs would be more appropriate.)
- Review and fill out the applicable sections for the selected PEF type.
- Data may be entered or revised in all white cells. Note that empty cells contain a period (indicated with green boxes in the image below).
Leave the period if you cannot supply a value for a parameter.
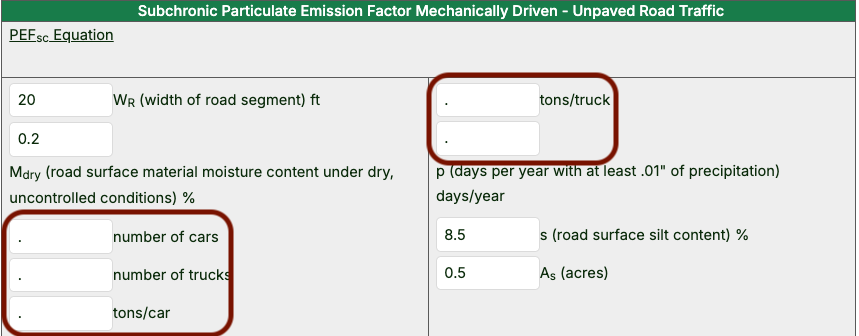
- To find a suitable value for p (days per year with at least 0.01” of precipitation), contact your regional risk assessor and/or consult exhibit E-4 of the 2002 EPA Supplemental Soil Screening Guidance document.
- Once the blank cells have been filled and any other cells have been edited as necessary, the PEF values will be shown in their own sections below the beginning soil concentration cells.


Chemical VF Transport Calculator
The VF, like PEF, is an inhalation variable that has different methods of calculation. The VF Transport Calculator guides the user through the calculation of the following:
- Infinite Source Chronic Volatilization Factor (VFulim)
- Mass-limit Chronic Volatilization Factor (VFmlim)
- Unlimited Source Subchronic Volatilization Factor for Construction Worker (VFulim-sc)
- Mass-limit Subchronic Volatilization Factor for Construction Worker (VFmlim-sc)
For more information on these VF types, see sections 4.10.4 through 4.10.7 of the Chemical Risk Calculator User Guide.
Instructions for the Chemical VF Transport Calculator:
- Select “Media Transport from the Tools menu; then select “VF Transport Calculator”.
- There is an option to enter the title of your project for the downloadable XLSX of output values.

- Select chronic or subchronic RfDs and RfCs. (The construction and excavation worker scenarios usually use subchronic values because the land use is limited to an exposure duration of 1 year.)
- Select chemicals of interest by typing in the box (note that synonyms and CAS numbers are listed) and pressing enter. Multiple chemicals may be entered.
- On the next screen, input the soil concentrations.
- Review the equations and parameters listed on the page.
- By default, the calculator will generate volatilization factors and air concentrations using the “VF Unlimited Reservoir Equation - Method 1” equation.
- In order to generate values for volatilization factors and air concentrations using the “VF Mass Limit Equation - Method 2” equation, you will need to supply the average source depth (ds).
- In the example below, ds was not supplied; therefore, volatilization factors and air concentrations were only generated for Unlimited Reservoir.

MODULE #5: Chemical Tools: Toxicity Assessment
The RAIS chemical toxicity and parameter tools provide a variety of information that can be used to either calculate risks or hazards (e.g., cancer slope factors and reference doses, respectively).
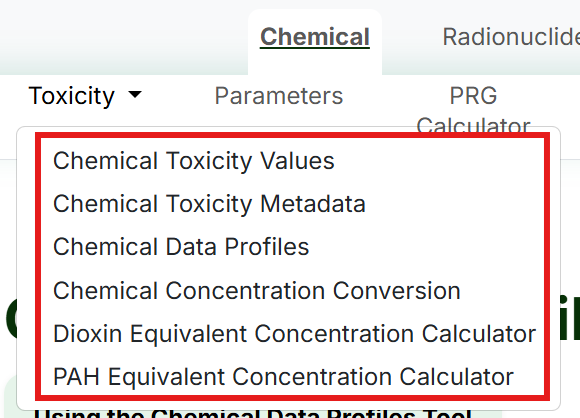
Clicking the names of the tools below takes you to the tutorial for that respective tool, with a link to that tool in that section that will take you out of the tutorial page.
The RAIS has seven methods for obtaining chemical information:
- The Chemical Toxicity Values Tool
- The Chemical Toxicity Metadata Tool
- The Chemical Data Profiles Tool
- The Chemical-Specific Parameter Search Tool
- The Concentration Conversion Tool
- PAH Equivalent Concentration Calculator
- Dioxin Equivalent Concentration Calculator
Chemical Toxicity Values Tool
Link to the tool: Chemical Toxicity Values Tool
The Chemical Toxicity Values tool provides human health toxicological values for multiple chemicals simultaneously. The following toxicological values for chemicals (as well as their associated references) are available in the RAIS Chemical Toxicity Values tool:
- Oral Reference Doses (acute, chronic, subchronic, short-term)
- Inhalation Reference Concentrations (acute, chronic, subchronic, short-term)
- Oral Slope Factors
- Inhalation Unit Risks
The toxicity values for each chemical are chosen based on the EPA OSWER Directive 9285.7-53 (EPA, 2003), which describes the recommended hierarchy of toxicity value sources. See section 2.3.2 of the Chemical PRG Calculator User Guide for more information.
Using the Chemical Toxicity Values tool
- There is an option to enter the title of your project for the downloadable XLSX of output values.

- Select chemicals of interest by typing in the box (note that synonyms and CAS numbers are listed) and pressing enter. Multiple chemicals may be entered.
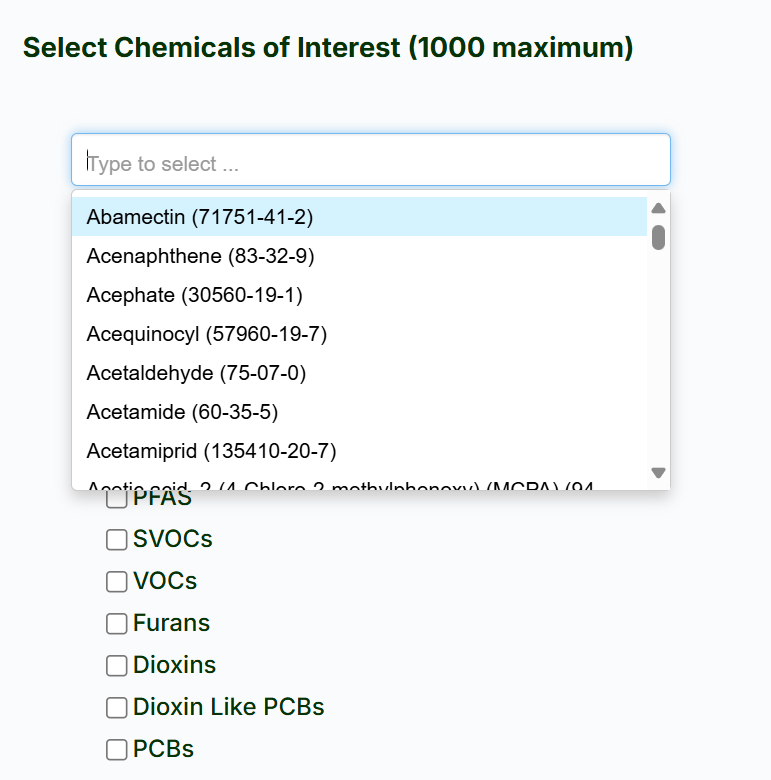
- Select the desired toxicity values (click the button to "Select All").
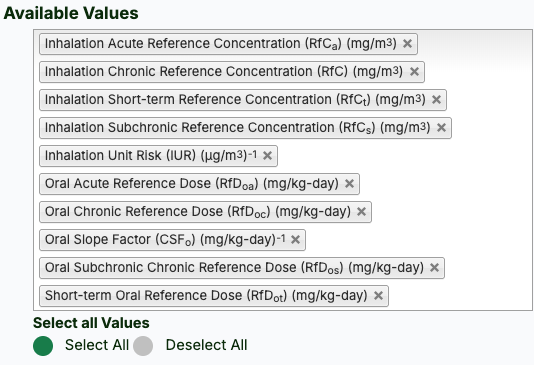
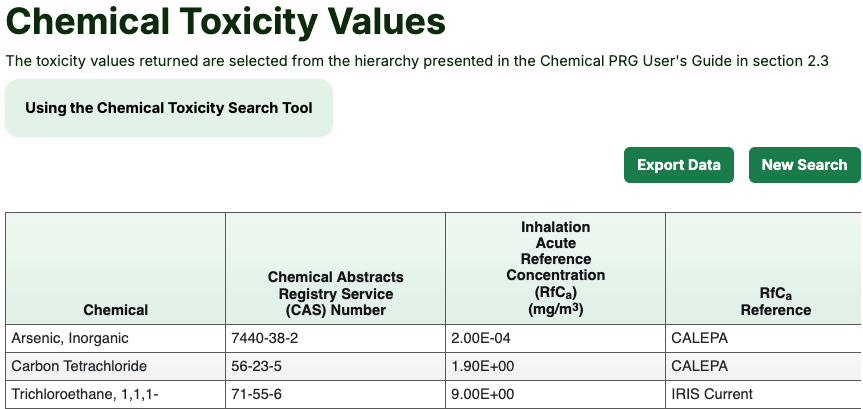
- Press the “Retrieve” button to view the available toxicity values and their sources. As can be seen in the image below, toxicity values are not always available for some chemicals.
Chemical Toxicity Metadata Tool
Link to the tool: Chemical Toxicity Metadata Tool
The Chemical Toxicity Metadata tool provides toxicity values as well as supporting information, such as target organs and details of the studies that produced the toxicity values, for the following:
- Oral Chronic Reference Dose
- Oral Subchronic Reference Dose
- Inhalation Chronic Reference Concentration
- Inhalation Subchronic Reference Concentration
- Oral Slope Factor
- Inhalation Unit Risk
The toxicity values for each chemical are chosen based on the EPA OSWER Directive 9285.7-53 (EPA, 2003), which describes the recommended hierarchy of toxicity value sources. See section 2.3.2 of the Chemical PRG Calculator User Guide for more information.
Using for Chemical Toxicity Metadata tool
- There is an option to enter the title of your project for the downloadable XLSX of output values.

- Select chemicals of interest by typing in the box (note that synonyms and CAS numbers are listed) and pressing enter. Multiple chemicals may be entered.
- Select the desired toxicity metadata (click the button to "Select All").
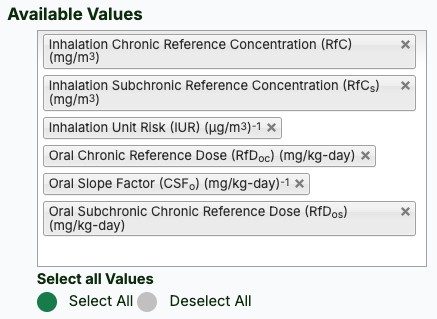
- Click the "Retrieve" button.
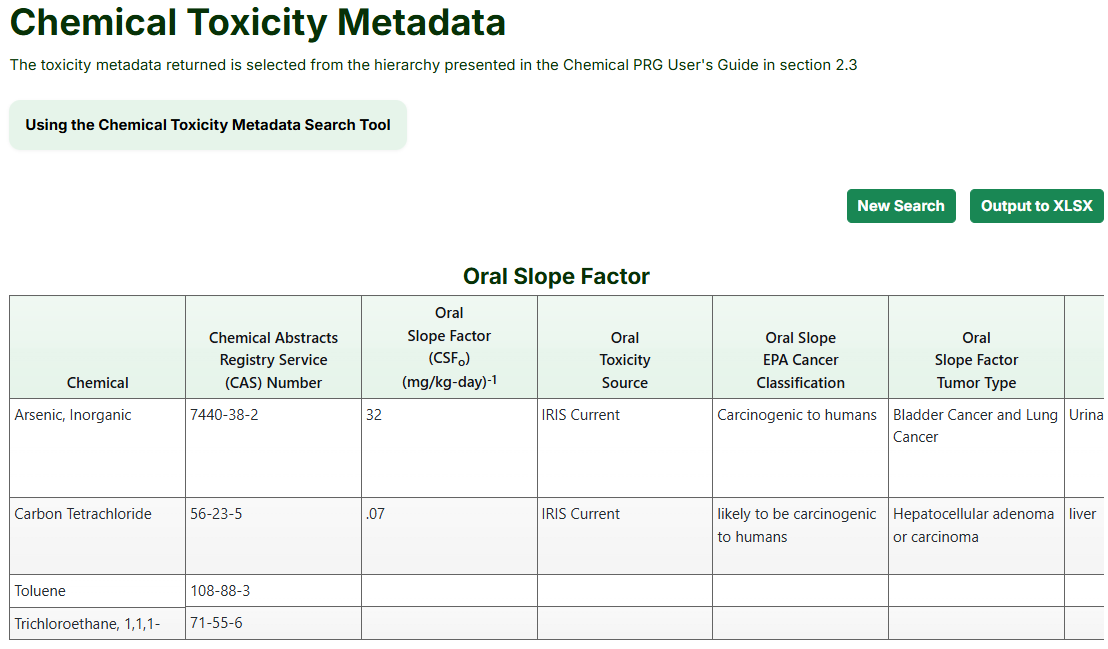
- The following page will show separate tables for each toxicity value type, as seen below,
which can be downloaded by pressing the "Output to XLSX”" button.
Chemical Data Profile Tool
Link to the tool: Chemical Data Profile Tool
The Chemical Data Profiles tool provides basic information, toxicity values, and chemical-specific parameters (e.g., volatilization factor) for a selected chemical. The unique aspect of the RAIS Chemical Data Profiles tool is that data is displayed from a variety of federal, state, and other sources. While the Chemical Toxicity Values and Chemical Toxicity Metadata tools provide toxicity values based on the EPA hierarchy of toxicity values, the Chemical Data Profiles tool shows all available toxicity values and indicates which values are used in the calculators.
Using the Chemical Data Profiles tool
- Select a chemical of interest from the dropdown menu.

- Press the "Retrieve” button.
- The resulting page will show the RAIS chemical data profile for the selected chemical. The profile starts with basic information about the chemical (e.g., molecular weight) and then moves into toxicity and parameter information.
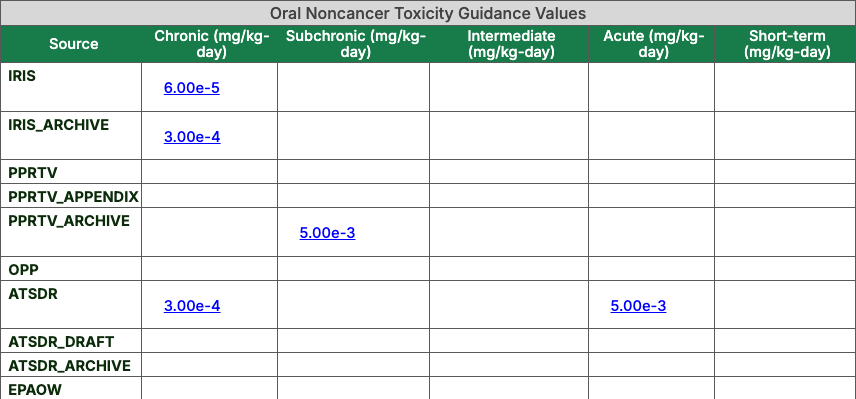
- The toxicity information section shows separate tables for oral noncancer, inhalation noncancer, and cancer values. As previously mentioned, the Chemical Data Profiles
show all values considered for each toxicity value; the shading indicates which value is used in the chemical calculator tools.
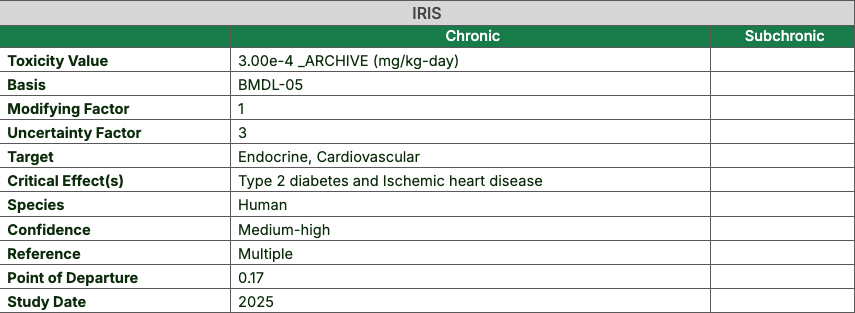
- Click any value to access the toxicity value’s metadata, which includes supporting information like the uncertainty factor
associated with the value. Metadata is not available for toxicity values from CALEPA or EPA OW.
Chemical-specific Parameters Search Tool
Link to the tool: Chemical-specific Parameters Search Tool
The Chemical-Specific Parameters Search tool provides chemical-specific parameters for multiple chemicals simultaneously.
Using the Chemical-specific Parameters Search tool
- There is an option to enter the title of your project for the downloadable XLSX of output values.

- Select chemicals of interest by typing in the box (note that synonyms and CAS numbers are listed) and pressing enter. Multiple chemicals may be entered.
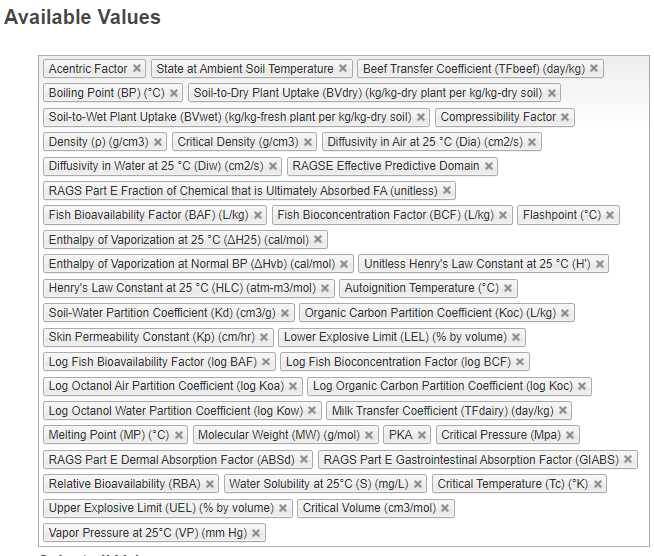
- Select the desired parameter values (click the "Select All" button to select all parameters). The available values can be seen in the image below.
- Click the "Retrieve" button.
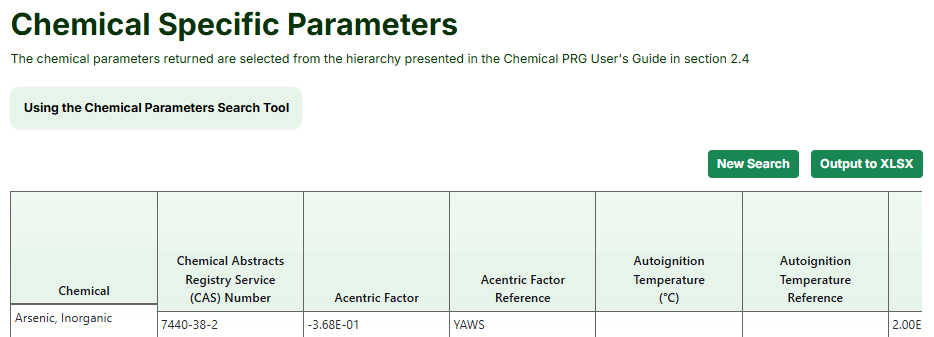
- The Results page presents a table with all of the available parameter values, which can be downloaded by pressing the "Output to XLSX" button. In this tool, the RAIS only
shows the chemical parameters that it has chosen based on the EPA hierarchy of chemical parameter sources, as explained in Section 2.4.2 of the Chemical PRG Calculator User Guide .


Chemical Concentration Conversion Tool
Link to the tool: Chemical Concentration Conversion Tool
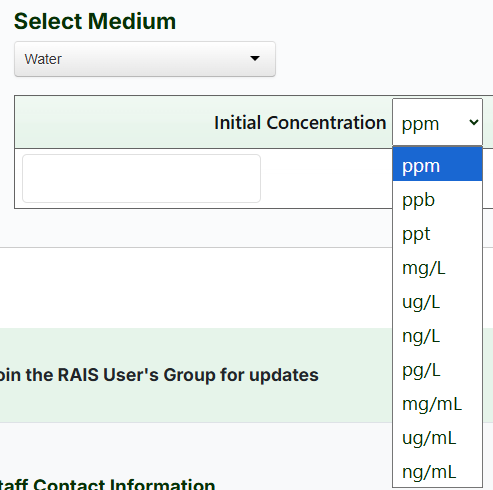
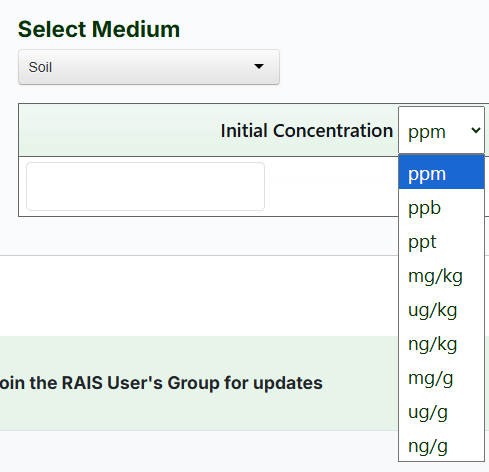
The Chemical Concentration Conversion tool provides conversions in three mediums (Air, Soil, Water) . It supports conversions within the following units:
Water Units
Soil Units
Air Units
Using the Chemical Concentration Conversion tool
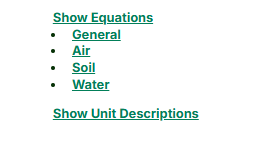
- Before beginning to use the tool, there is the option below 'Select Medium' to view the equations used for each medium. As well as descriptions of the units used. Clicking on the respective text 'Show Equations' and 'Show Unit Descriptions' will bring up tables with their respective information for further understanding of the tool.
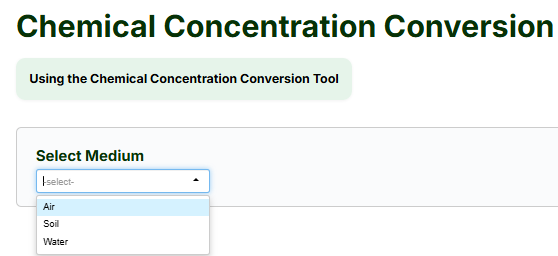
- Select your medium of interest by clicking on one of the three options from the drop down box. (Air, Soil, Water)
-
The soil and water conversions are the same except for the units of conversion.
This tool works both ways, meaning you can enter a final concentration and convert into the initial or vice versa.
- For "Air" medium only, there is an option to enter the title of your project for the downloadable XLSX of output values.

- Select your chemicals of interest by typing or clicking in the "Select Chemicals"(note that synonyms and CAS numbers are listed) box and pressing enter.
Multiple chemicals may be entered.

- Select units of temperature.
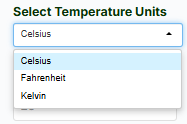
- Write in the "initial temperature" and "final temperature" for the concentration conversion.

- Select units of pressure (atm, kPa, mmHg).
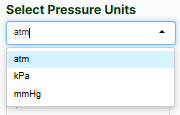
- Write in the "initial pressure" and "final pressure" for the concentration conversion, and select the units.

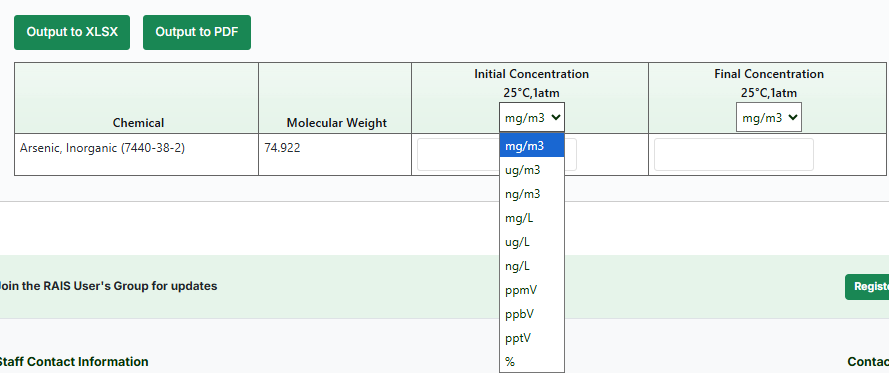
- Input either your "initial concentration" or "final concentration" for your chemical(s), and these columns work both ways. Meaning that you can input a final concentration and get the initial and vice-versa.
This table is downloadable by clicking on the "Output to XLSX" or "Output to PDF" buttons.
Polycyclic Aromatic Hydrocarbons (PAHs) Equivalent Concentration Calculator Tool
Link to the tool: PAHs Equivalent Concentration Calculator Tool
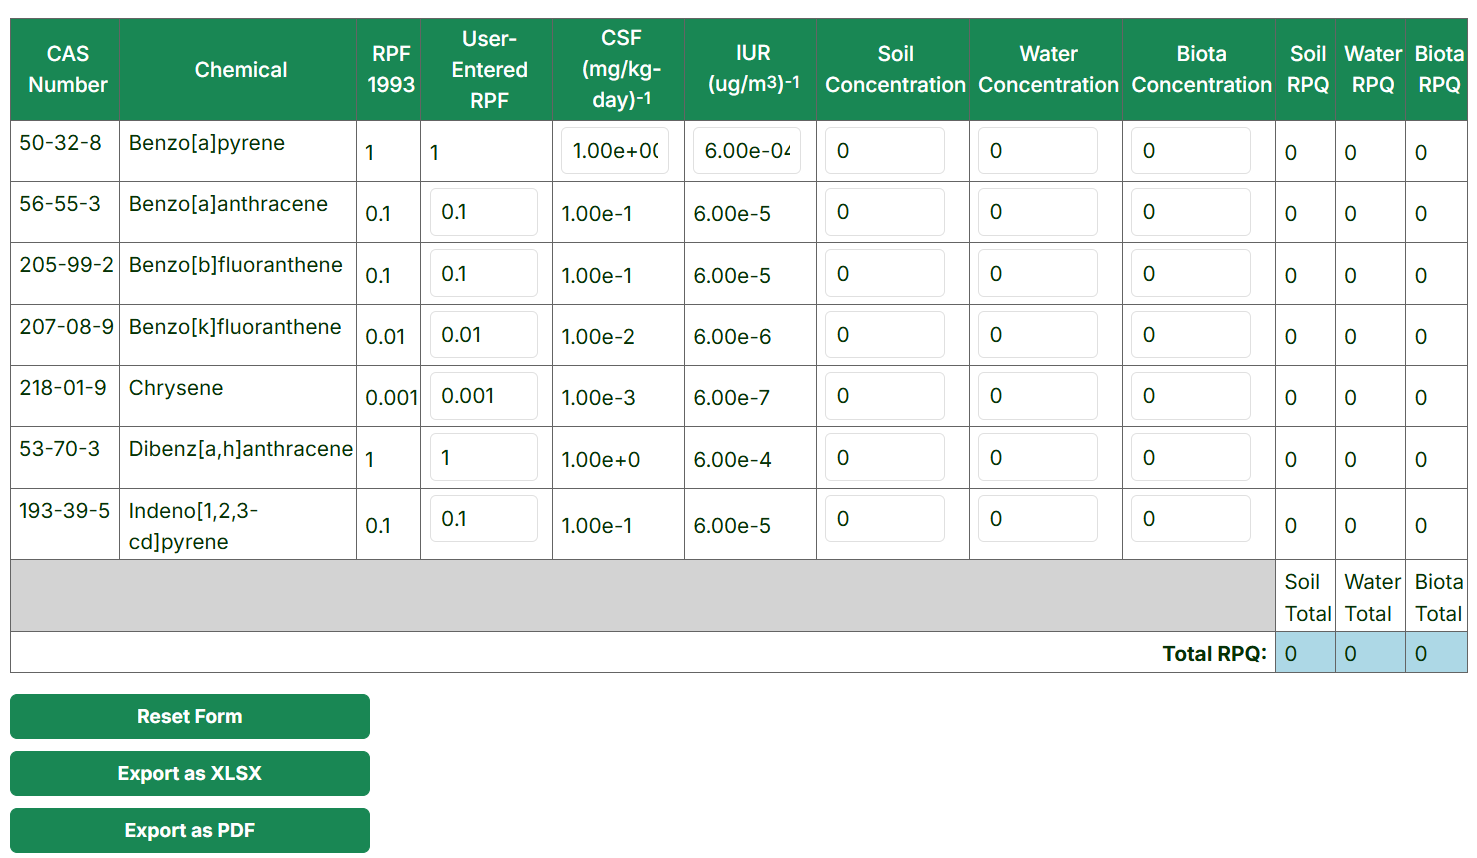
The PAH Equivalent Concentration Calculator tool combines the toxicity of different PAHs by applying relative potency factors (RPFs) to each congener's concentration, giving a relative potency concentration (RPQ) comparable to benzo[a]pyrene for risk assessment.
Using the PAH Equivalent Concentration Calculator tool
- Enter a project title (optional) for the downloadable XLSX of output values.

- Pick the relative potency factor(RPF): RPF 1993, RPF 2010, RPF 2006. With RPF 1993 being the default for the calculator.
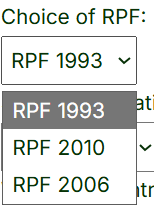
-
Select the Soil, Water, and Biota Concentration Units.
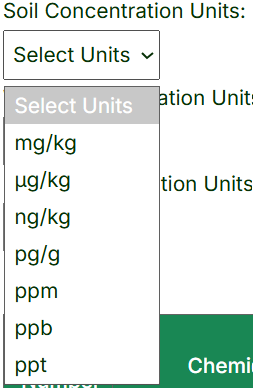
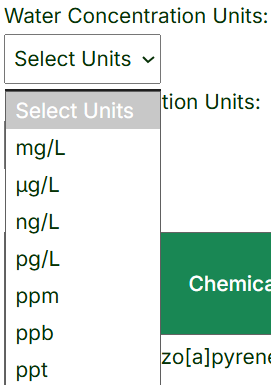
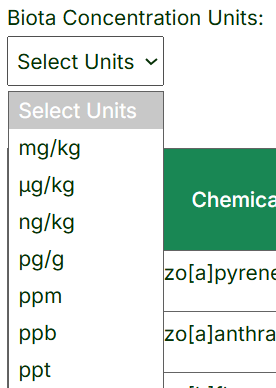
- The final table allows for the input of RPF values specific to your program, if needed, under the "User-Entered RPF" column. Any altered cell will be outlined in orange if the RPF value is changed. The "Reset Form" button will reset the RPFs, media concentrations, and units for the source. To download this table click on "Export as XLSX" or "Export as PDF" buttons.
Dioxin Equivalent Concentration Calculator tool
Link to the tool: Dioxin Equivalent Concentration Calculator Tool
The Dioxin TEQ Calculator estimates the combined toxicity of dioxins, furans, and dioxin-like PCBs by applying toxicity equivalency factors (TEFs) to each compound, producing a total toxicity equivalent concentration (TEQ) comparable to 2,3,7,8-TCDD. It calculates TEQs for soil, water, biota, oral cancer slope factor (CSFo), inhalation unit risk (IUR), chronic oral reference dose (RfD), and chronic inhalation reference concentration (RfC). It provides related toxicity values for risk assessment.
Using the Dioxin Equivalent Concentration Calculator tool
- Enter a project title (optional) for the downloadable XLSX of output values.

- Pick the toxicity equivalency factor(TEF): WHO-TEF 1998, WHO-TEF 2005, WHO-TEF 2022, BEF-TEF 2005. With WHO-TEF 2005 being the default for the calculator.
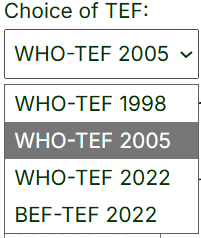
-
Select the Soil, Water, and Biota Concentration Units.


- The final table allows for the input of TEF values specific to your program, if needed, under the "User-Entered TEF" column. Any altered cell will be outlined in orange if the TEF value is changed.
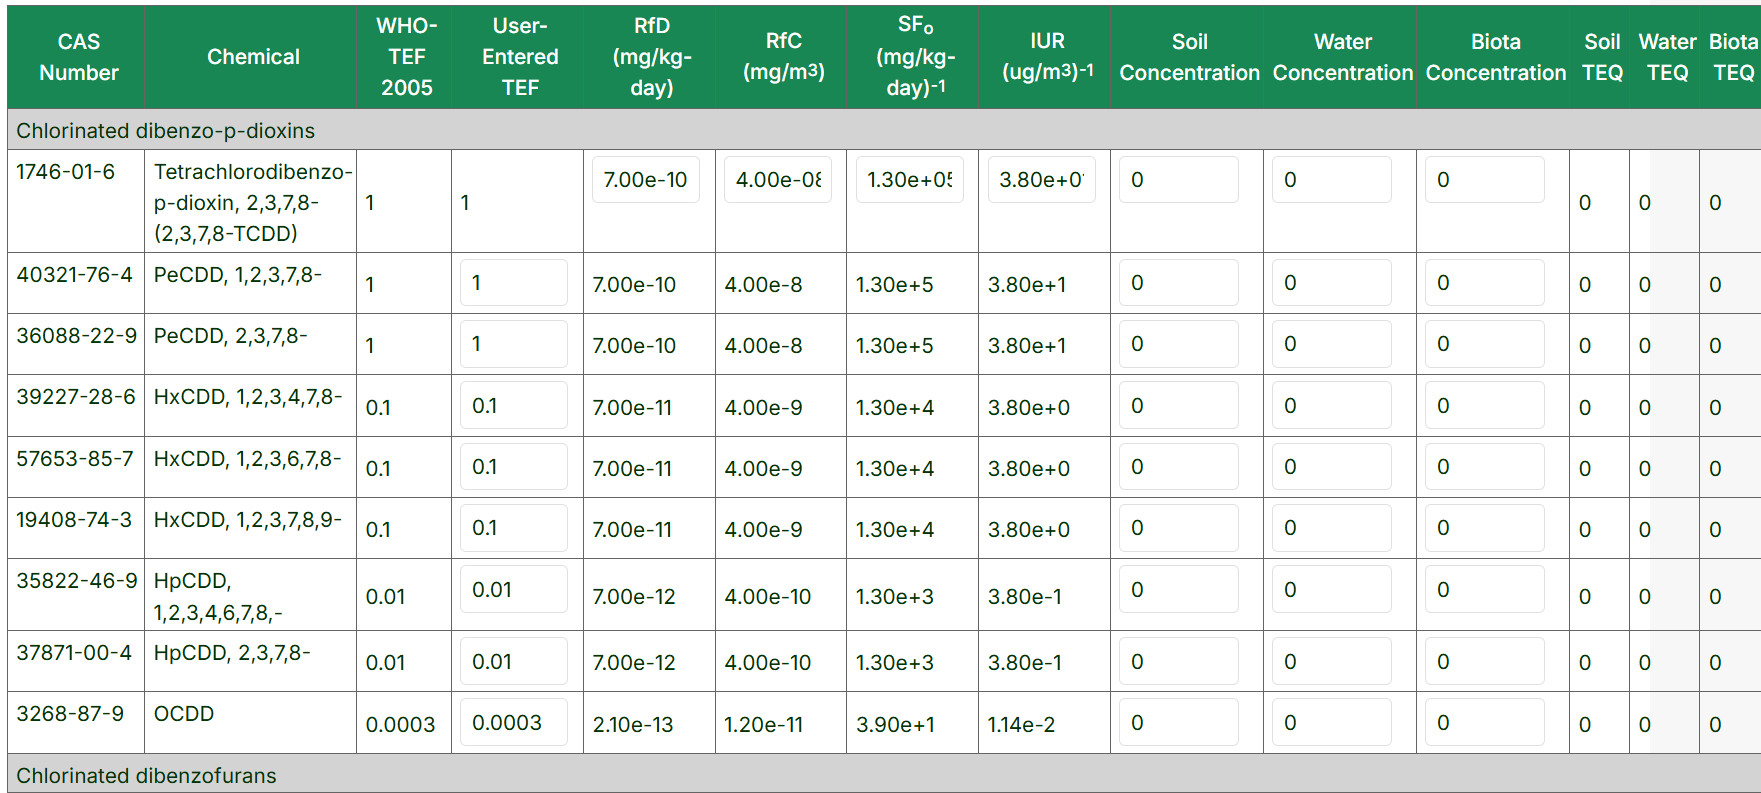
- The "Reset Form" button will reset the RPFs, media concentrations, and units for the source. To download this table click on "Export as XLSX" or "Export as PDF" buttons.
MODULE 6: Chemical Tools: Risk Characterization
For this tutorial, we will continue the example hypothetical situation with a contaminated stream at Site A. Nearby residents drink water and eat fish from the stream. After the PRG screening step, we were left with three COPCs for risk characterization: arsenic, carbon tetrachloride, and 1,1,1-trichloroethane.
Chemical Risk Calculator
This calculator assists with decision-making at hazardous waste sites to determine whether levels of contamination found at the site may warrant further investigation or site cleanup or whether no further investigation or action may be required. The COPCs found in the Data Screening step (see module 2) will be run through the Chemical Risk calculator to determine if they are Contaminants of Concern (COCs). To learn more, refer to the Chemical Risk Calculator User Guide.Using the Chemical Risk Calculator
- Select Risk Calculator from the Chemical Tools menu.
- There is an option to enter the title of your project for the downloadable XLSX of output values.

- Select the land use scenario and the Media option(s). (For this example, as in Module 2, selct Resident, Tap Water (as the residents are using the water from Site A for household purposes) and Fish.)
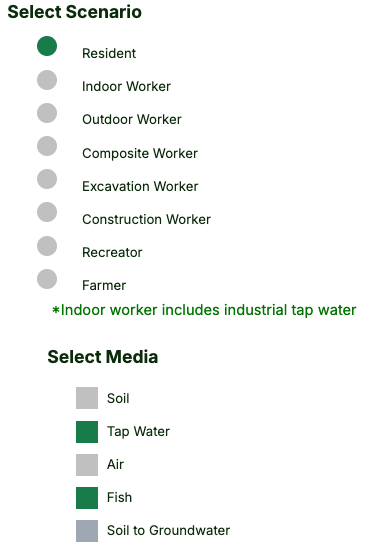
- Select Chemical Data Source.
- "Database Hierarchy Defaults" uses the default toxicity values and chemical-specific parameters (see sections 2.3 and 2.4 of the Chemical Risk User Guide) but allows users to alter equation parameters.
- "User-provided" allows users to review/alter the toxicity values and chemical-specific parameters as well as equation parameters.
- For the example test case, select "Database Hierarchy Defaults".
- Select the RfD/RfC Type. Chronic toxicity values are developed to be protective for long-term exposures (generally greater than 7 years). Subchronic toxicity values are used for short-term exposures. For this example, select Chronic.
- Select chemicals of interest by typing in the box (note that synonyms and CAS numbers are listed) and pressing enter. Multiple chemicals may be entered.
(For this example, select the three COPCs from the data screening step: arsenic, inorganic; cabon tetrachloride; and 1,1,1-trichloroethane.)
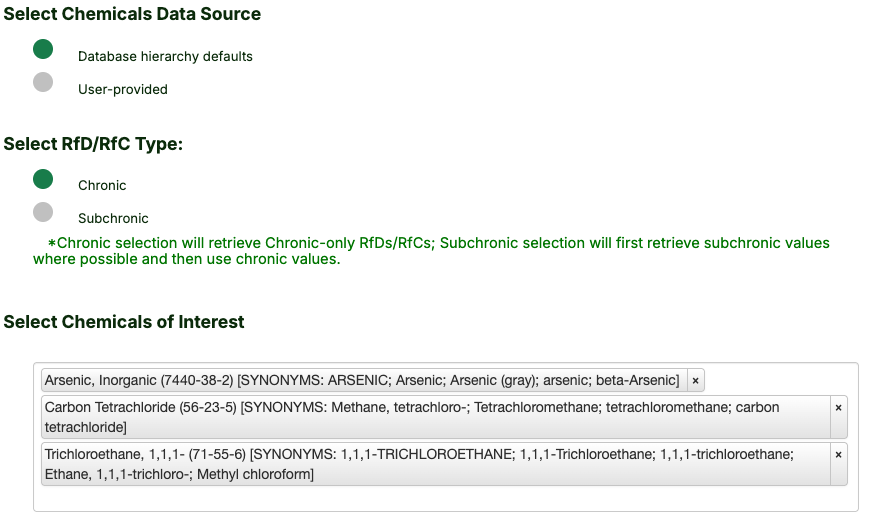
- Click the “Display Risk/HI Output in Percentage” checkbox to generate a separate table with each analyte’s percent contribution to total risk.

- On the next screen, enter the media concentrations. (For our example, use the Maximum Detected Concentrations (MDC) from Table 5 of Module 2.)
- The first two columns, “Surface Water (Fishing) (mg/L)” and “Fish (mg/kg)”, are both associated with the Fish medium. The carbon tetrachloride MDC concentration (0.85 mg/kg) will be entered into the “Fish (mg/kg)” column. The “Surface Water (Fishing) (mg/L)” column will remain blank because we do not have data for surface water associated with fish ingestion.
- Enter the water concentrations for arsenic, inorganic (1.3 µg/L) and 1,1,1-trichloroethane (12,600 µg/L) into the “Tap Water” media column since the residents at Site A use the water for household purposes.
- Make sure to enter a period (".") into cells with no data, as the calculator cannot run with empty cells.

- Below the media concentration table are the exposure assessment details. All pink and white cells may be modified, as needed, with justification. (For this example scenario, do not change any parameters.)
- View the chronic daily intake equations by clicking the blue linked exposure route name. The ingestion of fish route is displayed below.

- Press the "Retrieve" button. Results are presented in the next screen, organized by exposure media.
- Review the exposure parameters at the top of each Result section to compare site-specific changes to the default values. (Since no changes were made to any of the exposure parameters in the example scenario, the “Default Value” column should match the “Site-Specific Value” column.)
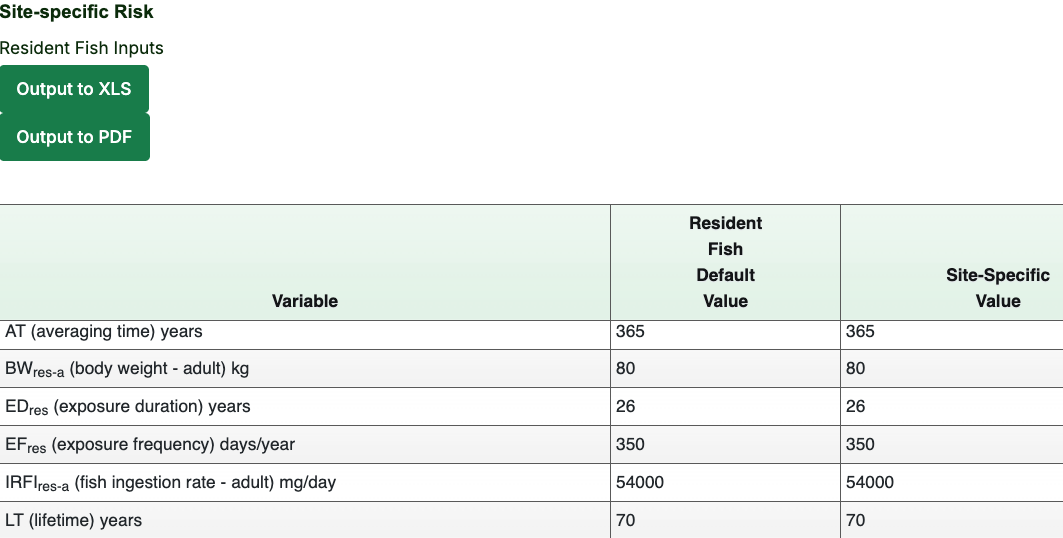
- Review the risk results for each media under the Input tables. Note the toxicity value sources used for risk calculations to be sure the sources are acceptable to local authorities.
Evaluation of Chemical Risk Calculator Results:
In the case of our hypothetical stream contamination situation, our next step for the baseline risk assessment would be to evaluate the risk calculator outputs and determine next steps. The risk results (excess lifetime cancer risk [ELCR] and noncancer hazard results) and percent contribution to total risk results are summarized and reproduced below for each medium and exposure pathway. Calculations were performed June 19, 2023.
Table 6: Summarized Chemical Risk Results and Percent Contribution to Total - Tap Water

Table 7: Summarized Chemical Risk Results and Percent Contribution to Total - Fish

The results are color-coded to identify risk ranges and potential contaminants of concern, as explained below:
Hazard Range (defined as “Hazard Index [HI]” or “Hazard Quotient [HQ]”):
- HQ or HI < 0.1: No shading
- HQ or HI > 0.1: Purple
- HQ or HI > 1: Blue
Risk Range (ELCR):
- Risk < 0.000001 (1E-06): No shading
- Risk > 0.000001 (1E-06): Orange
- Risk > 0.0001 (1E-04): Red
- Risk > 0.01: Black
For individual contaminants, an HI above 1 is generally believed to pose a noncancer effect, while an ELCR above 1E-05 is generally believed to pose a cancer risk. For the example Site A scenario, the risk calculator results indicate that all three contaminants are potential COCs. Carbon tetrachloride poses a slight concern for cancer risk for a lifetime consumption of fish, and the tap water results show that arsenic and 1,1,1-trichlorethane pose a significant cancer risk and noncancer effect to residents who use the stream for drinking water and household purposes.
More information about the chemical risk calculator result output can be found in Section 2 of the Chemical Risk Calculator User Guide.
MODULE #7: Radionuclide Tools: Data Screening to Determine COPCs
Test Case
The following example will be used for the Radionuclide tools in this tutorial. Due to worker concerns, a company has decided to investigate a recently bought office building situated at Site B known to have some historical radionuclide contamination. Site B is a 0.5-acre (2000 m2) site in Phoenix, AZ that will be staffed with indoor workers who will be exposed to soil and groundwater. Soil and groundwater samples were taken from Site B, and the results of the analyses are provided in the data set below for use in this tutorial.
Table 8. Data Set for Site B
| Radionuclide | Detection Frequency |
Maximum Detected Concentration |
Units | Detection Medium |
|---|---|---|---|---|
| Am-241 | 3/4 | 2 | pCi/g | Soil |
| Co-60 | 2/4 | 0.2 | pCi/g | Soil |
| Ra-226 | 4/4 | 30 | pCi/L | Groundwater |
| Tc-99 | 2/4 | 90 | pCi/L | Groundwater |
Radionuclide Background Values
For, radionuclide background concentrations, please see the "Background Values" tool under the Radionuclide Tools dropdown menu.
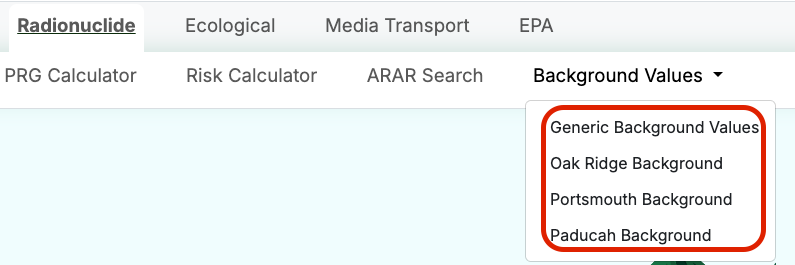
Guidance for comparing background data to site-related contaminant data is provided in the Guidance for Conducting Risk Assessments and Related Risk Activities for the DOE-ORO Environmental Management Program (BJC/OR-271), Appendix C. This background comparison guidance has been consistently used for the Oak Ridge Reservation; however, you should consult with your Regional Program Manager and appropriate Stakeholders before the background screen is performed to determine the appropriate method for your site.
The RAIS contains four options for background screening:
- Generic: generic soil background values for selected non-radionuclide chemicals
- Oak Ridge: site-specific background values from a Background Soil Characterization Project done at the Oak Ridge Reservation in 1993
- Portsmouth: site-specific background values for selected inorganic and organic chemicals in soil and groundwater at the Portsmouth Gaseous Diffusion Plant
- Paducah: site-specific background values for naturally occurring inorganic chemicals and selected radionuclides in soil (surface and subsurface) and groundwater (filtered and unfiltered) at the Paducah Gaseous Diffusion Plant
Please note that selecting “Background Values” under the Radionuclide Tools dropdown menu opens the same Chemical Background Tool pages, due to the limited range of analytes with Generic Background Values.
Obtaining Generic Radionuclide Background Values
- Select “Background Values” from the Radionuclide Tools menu; then select “Generic Background Values”.
- There is an option to enter the title of your project for the downloadable XLSX of output values.

- Select Individual Chemicals from the “available” box as seen below.

- Click “Retrieve”.
- On the Results page, click “Output to XLSX” to download the data as an .xlsl file or “New Search” to start a new search.
Obtaining Site-Specific Radionuclide Background Values
USelect “Background Values” from the Radionuclide Tools menu; then select "Oak Ridge Background", “Portsmouth Background”, or “Paducah Background”. The Results page will either display a table(s) of background values or references/links to background source documents.
Radionuclide ARAR Search:
Before performing an ARARs screen, be sure to check with your regulators (e.g., EPA Region IV does not perform the ARARs screen as part of the baseline human health risk assessment). Some states may only require that the ARARs for the detected analytes be reported in the remedial investigation report. Risk assessors should consult with appropriate regulatory agencies to determine which, if any, ARARs to screen against and the appropriate selection criteria based on the water body classification.
If you plan to use criteria from any of the 13 states offered in the RAIS ARAR Search tool, check the state webpages for the original sources of the ARARs, in case there have been recent updates. Links to health and environmental agencies for U.S. States and Territories can be found here.
Few radionuclides are listed in ARARs, with the notable exceptions being tritium, radium, and uranium. Because of this, selecting “ARAR Search” from the Radionuclide Tools menu will bring you to the same page found under the Chemical Tools dropdown menu.
Instructions for Radionuclide ARAR Screen (Tennessee Source)
- Choose ARAR Search from the Radionuclide Tools menu.
- There is an option to enter the title of your project for the downloadable XLSX of output values.

- Under "Select ARAR Source", choose "Federal" or one of 13 states. For this example, select "Tennessee".
- Review the available criteria options and select those applicable to the project. (Click in the checkbox to "Select All" criteria for that group.)
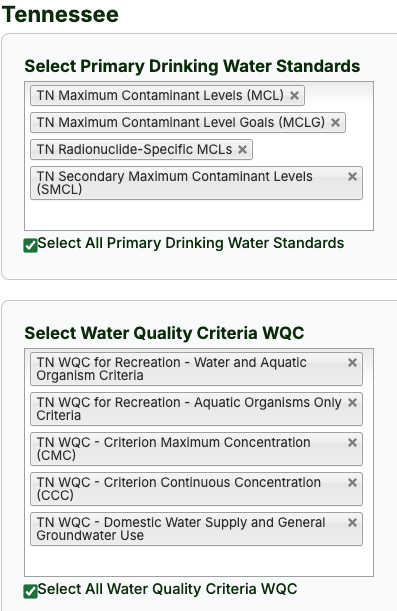
- Select individual chemicals from the “available” box.

- Press "Retrieve".
- Evaluate the results (make sure to refer to all applicable footnotes) based on appropriate guidance.
- Click “Output to XLSX” to download the data or “New Search” to start a new search.
Radiological Ecological Benchmarks
Because the risk-based PRGs in the database were developed to protect human health, they may not be adequately protective of nonhuman receptors. For sites where risk-based PRGs for ecological receptors are required, the RAIS provides the Ecological Benchmarks Tool for Radionuclides and the Ecological Benchmark User Guide.
Obtaining Radionuclide Ecological Benchmarks
- Choose “Ecological Benchmarks” from the Radionuclide Tools menu.
- There is an option to enter the title of your project for the downloadable XLSX of output values.

- Select from two benchmark sources (or Select All by clicking the checkbox below the dropdown). Sources include the Los Alamos National Laboratory ECORISK Database – Release 4.1
and the Texas Commission on Environmental Quality (TCEQ) benchmarks (recommended for use by U.S. EPA Region 6).
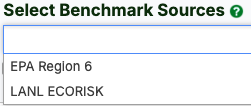
- Select media options (or Select All by clicking the checkbox below the dropdown). There are 3 available media options: sediment, soil, and surface water.
- Select radionuclides of interest from the “available” (left) box and press the >> button to move the analytes into the “selected” (right) box.
- Click the “Retrieve” button.
- The Results page shows the available ecological benchmarks by media (or a message if there are no ecological benchmarks for the selected radionuclides for that media).
- To download data to an .xlsx format, scroll to the bottom of the last table of benchmarks and click the “Output to XLSX” button.
- References for all benchmark sources and the list of all available footnotes are provided under the Results tables.
Radionuclide PRG Calculator
After screening against ARARs, the next step is to screen the data from Table 8 against the risk-based Preliminary Remediation Goals (PRGs). Radionuclide PRGs are calculated by selecting the applicable radionuclide(s) together with the applicable media, land use, and exposure route combination.
Radionuclide PRGs are generated on the RAIS by using the Radionuclide PRG Calculator. To learn more about the PRGs, refer to the Radionuclide PRG Calculator User Guide, which presents specific PRG Equations for each land use.
Using the Radionuclide PRG Calculator
This section uses the example Site B to generate PRGs. Site B is a 0.5-acre (2000 m2) office building in Phoenix, AZ staffed with indoor workers exposed to soil and groundwater contamination.
Please note that the session inputs for the PRG calculator can be saved for future use and recalled by the PRG calculator. Instructions for saving the session inputs and accessing them later are included in this section.
- Choose "PRG Calculator" from the Radionuclide Tools menu.
- There is an option to enter the title of your project for the downloadable XLSX of output values.

- Select the Target Risk (10-6 for this example).
- Select the Scenario and Media. (For this example, select Indoor Worker as the receptor group of concern. For media, select Soil and Tap Water.)

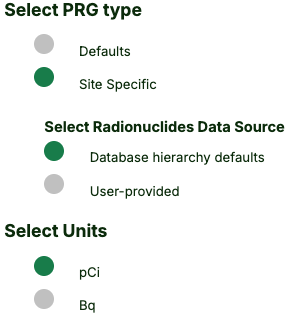
- Select PRG Type.
- "Defaults" uses the default slope factors and radionuclide-specific parameters for the PRGs.
- If "Site-Specific" is selected, the Radionuclide Data Source menu will appear with two options: 1) "Database hierarchy of defaults" uses the default slope factors and radionuclide-specific parameters but allows users to alter equation parameters and 2) "User-provided" allows users to review/alter the slope factors and radionuclide-specific parameters as well as equation parameters.
- Note: the RAIS will only provide the option to save your settings for a future run if either "Site-Specific" mode is selected.
- For this example, select "Site-Specific", "Database hierarchy defaults".
- Select the Units of choice. (For the example scenario, select pCi.)
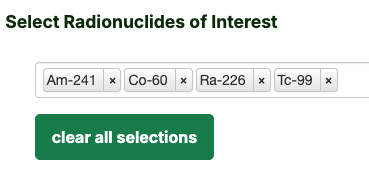
- Select radionculides of interest by typing in the box (note that synonyms and CAS numbers are listed) and pressing enter.
Multiple radionculides may be entered.
- Click Retrieve.
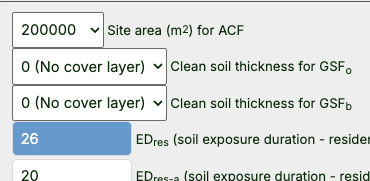
- If "Site-Specific" mode was selected, review/adjust all equation parameters, as needed (for "user-provided", also review/adjust the slope and radionuclide-specific parameters).
- For this example scenario, set the “Site Area (m2) for ACF" to be "2000" using the dropdown box in the first Soil Parameter box (this matches the site area B size of 0.5 acres).
- In the PEF parameter box, select "Phoenix, AZ" for the city. Note that the default value for “As (acres)” is 0.5 in the PEF parameter box, the same as Site B; so this parameter can remain.
- No other site-specific adjustments will be made for soil or tap water for this scenario.
- Click Retrieve to see results.
- If you do not want to save your work for a future run, proceed to the next step. Otherwise, follow the instructions below.
- At the top of the Results page, click “Yes” if you would like to save your work for a future run, enter your email (optional), and then click the “Save” button.

- A file number will be generated that should be used in the future to access all settings you used for this run.
If you chose to enter your email address earlier, this information will be sent to you in an email.

- To access your saved settings in a new run, go to the Radionuclide PRG Calculator page and click “Yes” in the box at the top that says “Do you have a previously saved file?”;
then enter the file number. For the second question, selecting yes will redo the PRG run with the same radionuclides and selections used previously.

- Click the “Retrieve Parameters” button to bypass the first page and go directly to the second calculator page where the site-specific inputs can be made. If we had made site-specific changes to the exposure parameters, these would be replicated here.
- Results are presented by media. The first table for each media will be the table of exposure parameter inputs. Here, site-specific adjustments can be verified (e.g., changing the city to “Phoenix, AZ” can be seen in the “Soil Inputs” tab).
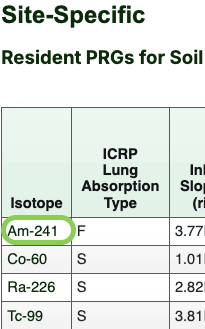
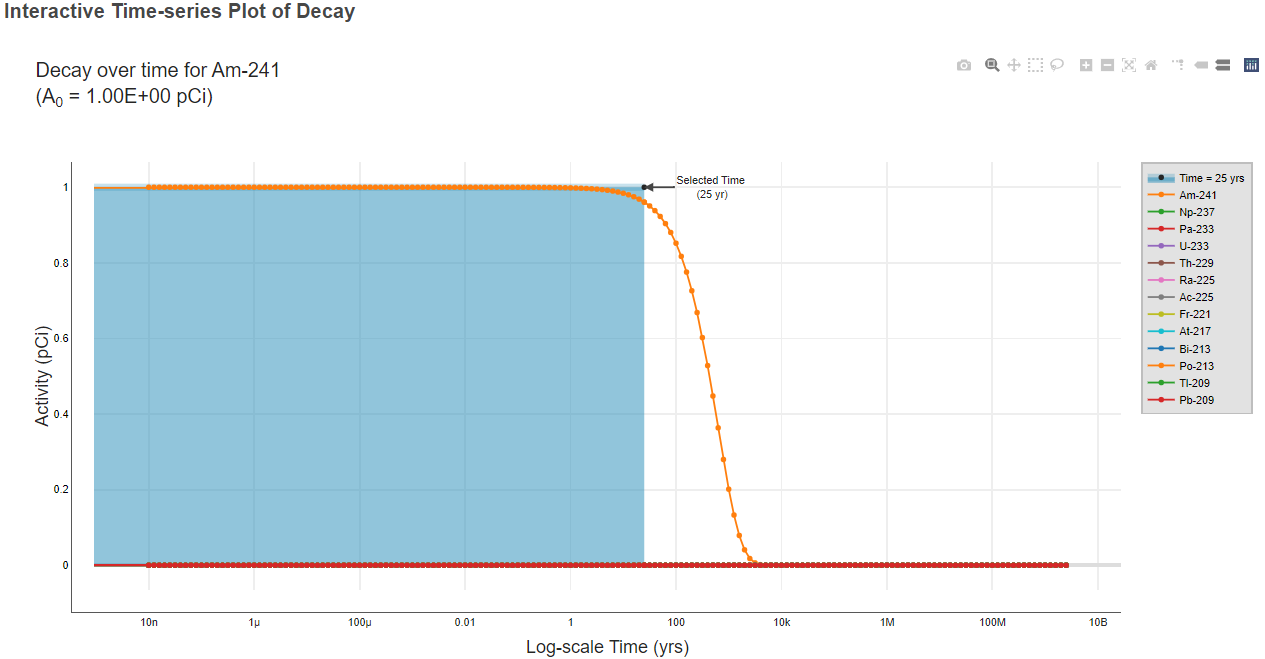
- The second result table for each media is the table of PRGs. These tables also provide the slope factors used to calculate the PRGs. Click an isotope hyperlink
(indicated with a green box in the image below) to view the decay chain data tables and an interactive time-series decay plot for that isotope.
Evaluation of Radionuclide PRG Calculator Results
In the case of our hypothetical radionuclide contamination scenario, our next step for the baseline risk assessment is to compare the PRGs against the relevant maximum detected concentrations (MDCs) from Site B, as presented in Tables 9 and 10. Calculations were performed July 21, 2023.
Table 9: Comparison of Soil Sample Data to PRGs (Radionuclide)
Table 10: Comparison of Tap Water Sample Data to PRGs (Radionuclide)
Any sample concentrations below the PRGs do not need to go forward in the baseline risk assessment. Otherwise, the analytes would be considered Radionuclides of Potential Concern (ROPCs). As can be seen in Tables 9 and 10, all radionculides except Am-241 will be considered ROPCs and move forward in the baseline risk assessment, where risks will be calculated for the workers at Site B.
MODULE #8: Radionuclide Tools: Media Transport Tools
The radionuclide media transport tools include the Radionuclide Groundwater Transport Calculator and the Radionuclide PEF Transport Calculator. There is no VF transport calculator for radionuclides, as most radionuclides are metals. The RAIS team has developed a separate Radon Vapor Intrusion Screening Level (RVISL) calculator for the EPA.

Radionuclide Groundwater Transport Calculator
The Radionuclide Groundwater Transport Calculator recreates the migration pathway of contaminants from soil to groundwater by calculating the expected groundwater concentration from user-provided soil concentrations. Parameters can be adjusted prior to exporting the results. Unlike other tools on the RAIS, the Radionuclide Groundwater Transport Calculator only considers the Resident receptor. The Resident is expected to be the most conservative option and therefore protective of other receptors.
For more information on the soil to groundwater pathway, see Section 4.9 of the Radionuclide Risk Calculator User Guide.
Using the Radionuclide Groundwater Transport Calculator
- Select “Media Transport Tools” from the Radionuclide Tools menu, then choose “Groundwater Transport Calculator”.
- There is an option to enter the title of your project for the downloadable XLSX of output values.

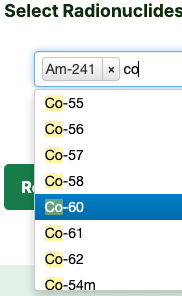
- Select radionuclides of interest by typing in the box and selecting the applicable radionuclides.
(For the hypothetical example, select Am-241 and Co-60.)
- Press the "Retrieve" button.
- On the next screen, enter soil concentrations for the selected radionuclides. (For our test case, enter the concentrations from Table 8 in Module 7).
- Review the “Dilution Factor for Migration to Groundwater Equations and Parameters” section.
- View the equation for the calculation of the Dilution Attenuation Factor (DAF) and the site diagram that shows how soil contaminants can migrate to underlying groundwater by pressing the blue links.
- If applicable, a site-specific DAF can be entered in this section to replace the default DAF value (1).

- Alternatively, enter site-specific values for the variables used in the DAF calculation, and the calculator will populate the blue box in the
“Migration to Groundwater” section. Otherwise, the default DAF value of 1 will be used.
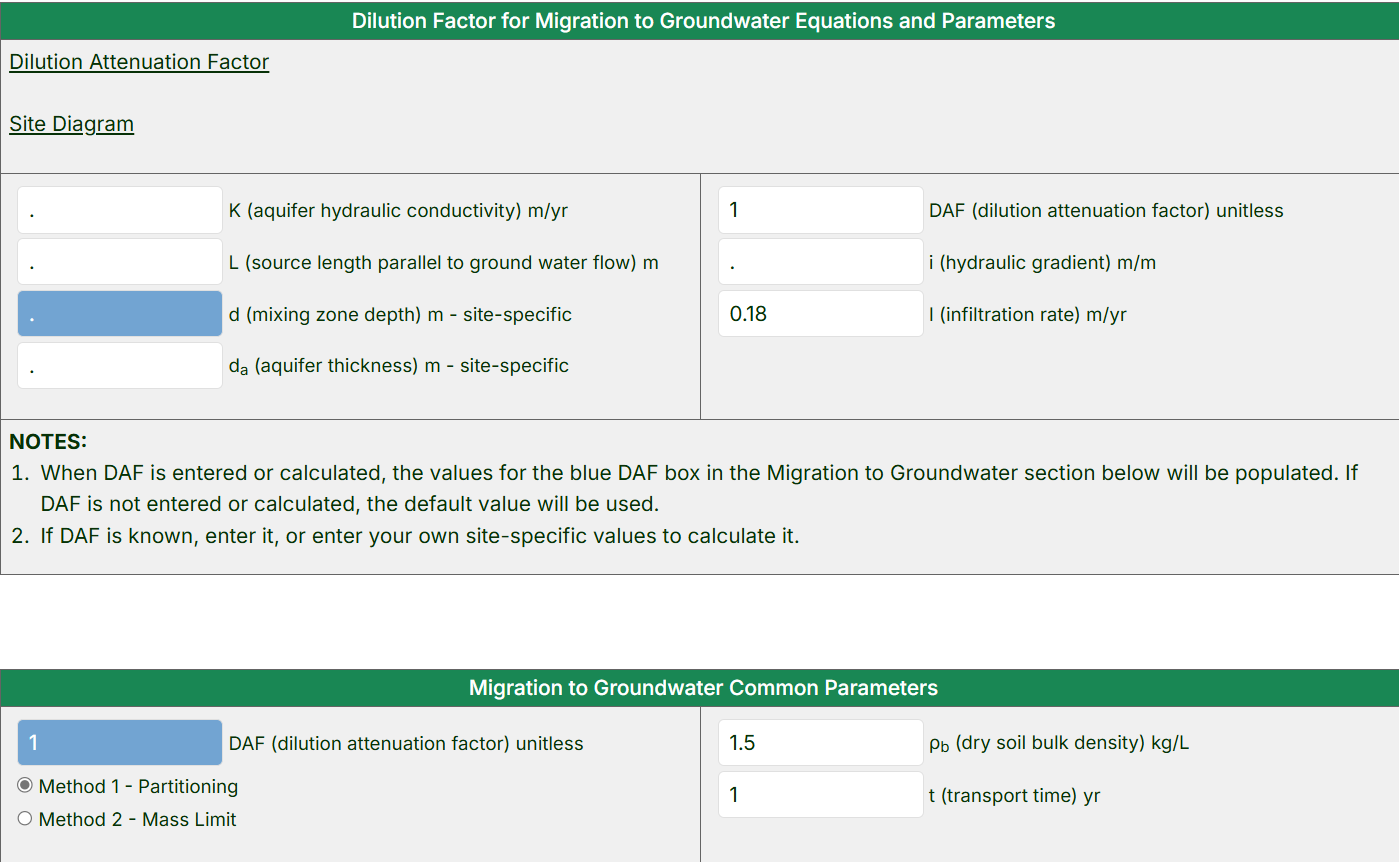
- By default, the RAIS calculator will show the equation and parameters for “Method 1 – Partitioning”. Select the “Method 2 – Mass Limit” option to use a different equation and parameters. For both, use the default parameter values shown or replace the defaults with site-specific values.

- After completing the review of the equations and parameters and making any necessary edits, click the “Retrieve” button to obtain the results or click the “Clear” button to start over.
- The Results page presents the “Migration to Groundwater Inputs” table, where any site-specific values used will be displayed alongside the default values. Below that, the results table will be shown (example below), with soil concentration(s) for the associated tap water concentration(s).

Radionuclide PEF Transport Calculator
There are differents PEFs that can be calculated based on the exposure scenario at hand. The Radionuclide PEF Transport Calculator guides the user through the calculation of the following PEFs:
- PEF Wind-Driven (PEF)
- Subchronic PEF Mechanically Driven – Unpaved Road Traffic (PEFsc)
- Subchronic PEF Mechanically Driven – Other Construction Activities (PEF’sc)
- Mechanical Particulate Emission Factor for Off-site Receptors (Standard Vehicle Traffic) (PEFoff)
- Mechanical Particulate Emission Factor for Off-site Receptors (Other Construction Activities) (PEF’off)
For more information on these PEF types, see Sections 4.10.1 through 4.10.3 of the Radionuclide Risk Calculator User Guide.
Using the Radionuclide PEF Transport Calculator
- Choose “Media Transport Tools” from the Radionuclide Tools menu. Then choose “PEF Transport Calculator”.
- There is an option to enter the title of your project for the downloadable XLSX of output values.

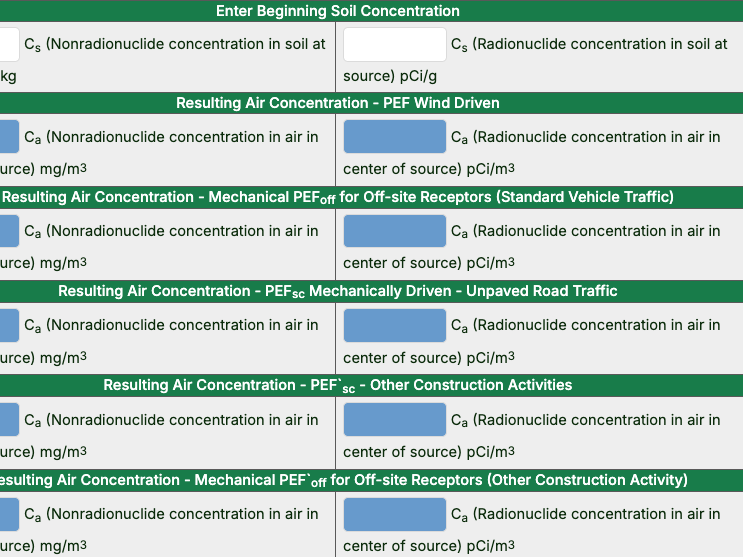
- Enter the beginning soil concentration in the left box for chemicals or right box for radionuclides.

- Determine the applicable PEF type. Each of the 5 PEF types will have their own sections, equations, and parameters. (For our hypothetical indoor worker scenario, the generic PEF (PEF Wind Driven) would be applicable given that construction is complete and the roads near the building are paved. If construction were ongoing, one of the other PEFs would be more appropriate.)
- Review the equations and enter site-specific values as needed.
- Data may be entered or revised in all white cells. Note that empty cells contain a period (indicated with green boxes in the image below).
Leave the period if you cannot supply a value for a parameter.

- For our example, change the city from “Default” to “Phoenix, AZ”. Note that the default value for “As (acres)” is 0.5, the same as Site B.

- To find a suitable value for p (days per year with at least 0.01” of precipitation), contact your regional risk assessor and/or exhibit E-4 of the 2002 EPA Supplemental Soil Screening Guidance document.
- Once the blank cells have been filled, the PEF values will be shown in their own sections.
MODULE #9: Radionuclide Tools: Toxicity Assessment
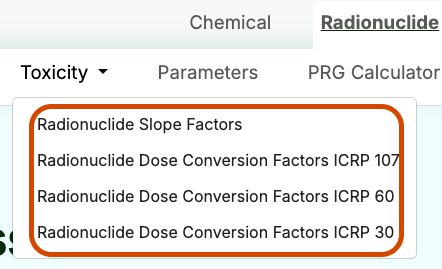
The RAIS radionuclide toxicity and parameter tools include:
- Radionuclide Slope Factors search tool
- Radionuclide Dose Conversion Factors search tools for:
- Radionuclide Parameters search tool
Radionuclide Risk Slope Factors
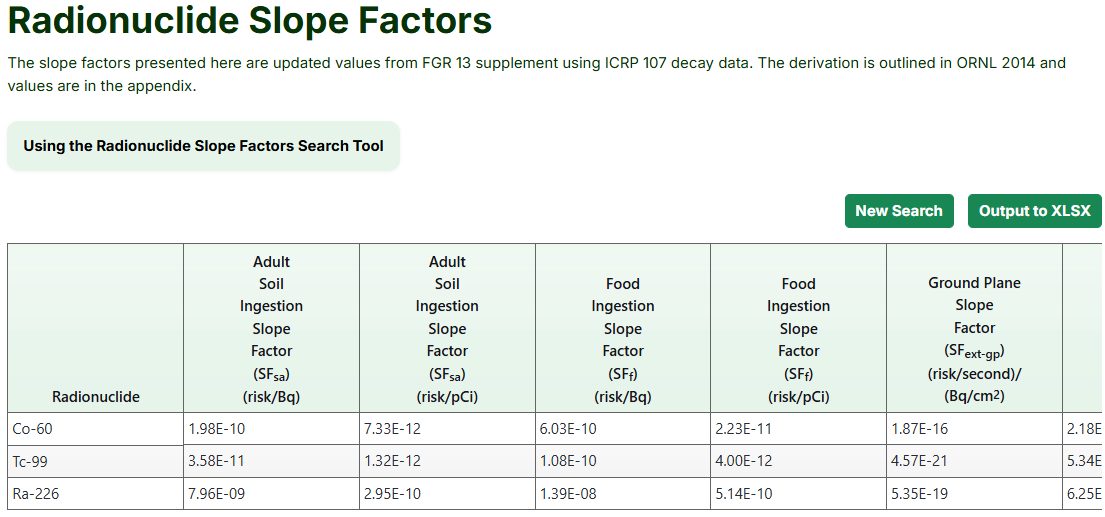
The SFs are updated values from Federal Guidance Report (FGR) 13 supplement (EPA, 1999) using the ICRP 107 decay data (ICRP, 2008). The derivation and values are in “Calculations of Slope Factors and Dose Coefficients” (ORNL, 2014). More information about the slope factors can be found in Section 2.3 of the Radionuclide Risk Calculator User Guide.
Using the Radionuclide Slope Factors Tool
- There is an option to enter the title of your project for the downloadable XLSX of output values.

- Select radionculides of interest by typing in the box (note that synonyms and CAS numbers are listed) and pressing enter.
Multiple radionculides may be entered.
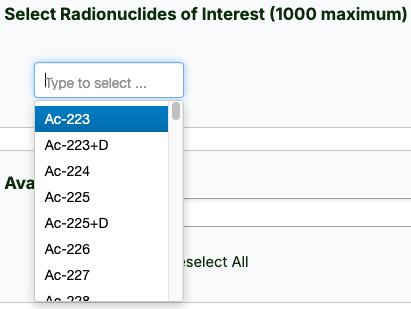
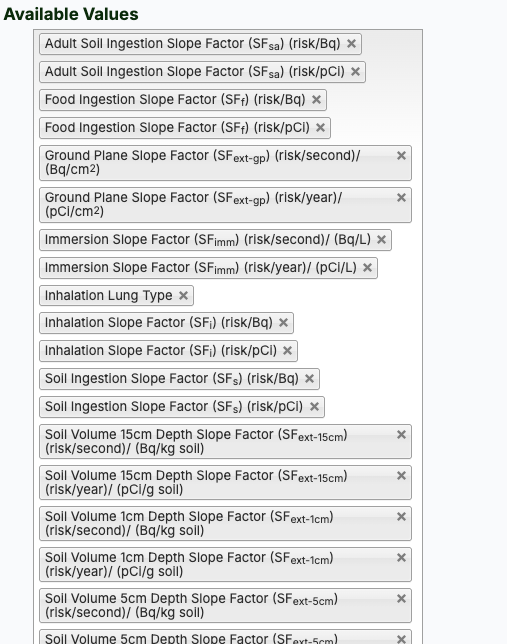
- Select applicable slope factors from the "Available Values" box or click the "Select All" button (the image below shows all available values).
- Press the "Retrieve" buttom.
- The following page displays a table with all selected slope factors, which can be downloaded by clicking the “Output to XLSX” button.
Radionuclide Dose Conversion Factors
Radionuclide dose conversion factors, also known as dose coefficients, are used alongside SFs for radionuclide calculations. The dose conversion factors from ICRP 107 are updated values from FGR 13 supplement (EPA, 1999) using ICRP 107 decay data (ICRP, 2008). The derivation and values are in “Calculations of Slope Factors and Dose Coefficients” (ORNL, 2014). The dose conversion factors from ICRP 30 can be found in FGR 11 (EPA, 1988), and the dose conversion factors from ICRP 60 can be found in FGR 12 (EPA, 1993).
Using the Radionuclide Dose Conversion Factor Tools
- There is an option to enter the title of your project for the downloadable XLSX of output values.

- Select radionculides of interest by typing in the box (note that synonyms and CAS numbers are listed) and pressing enter. Multiple radionculides may be entered.
- Select the applicable conversion factors from the "Available Values" box or press the "Select All" button. The image below shows some of the available values for ICRP 30.
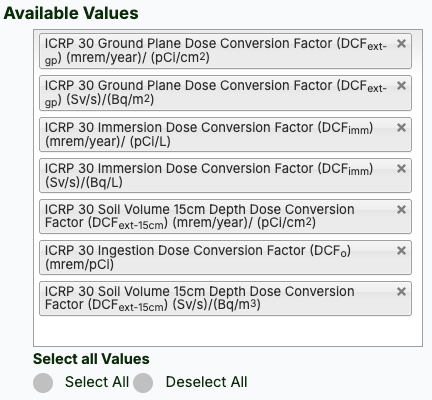
- Press the "Retrieve" button.
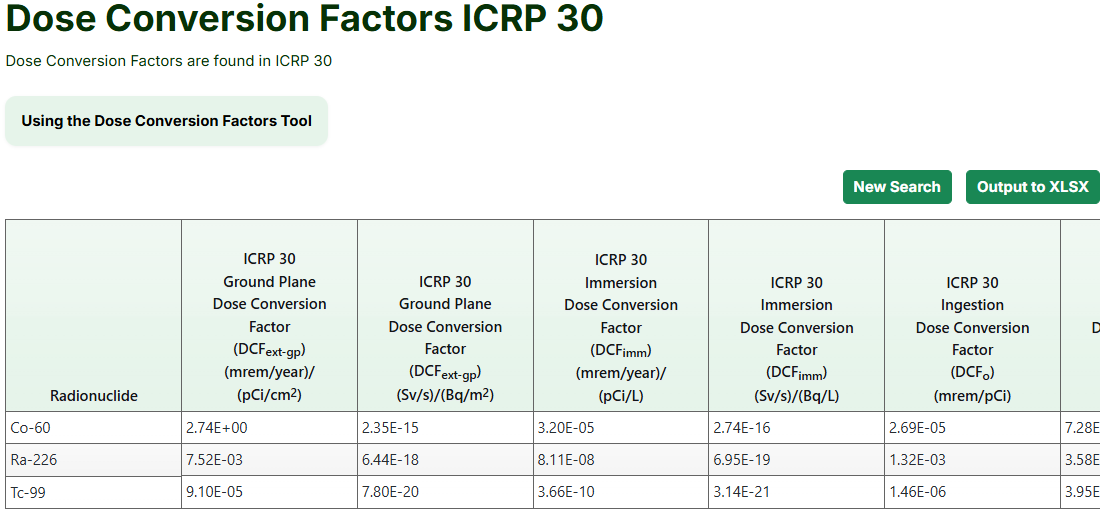
- The following page displays a table with all selected conversion factors, which can be downloaded by clicking the “Output to XLSX” button.
The image below shows a portion of the table for ICRP 30.
Radionuclide Parameters
The radionuclide parameters shown in this tool follow the hierarchy of parameter sources explained in Section 2.4.2 of the Radionuclide Risk Calculator User Guide.
Using the Radionuclide Parameters Tool
- Select radionuclides of interest by typing in the box and selecting the applicable radionuclides.
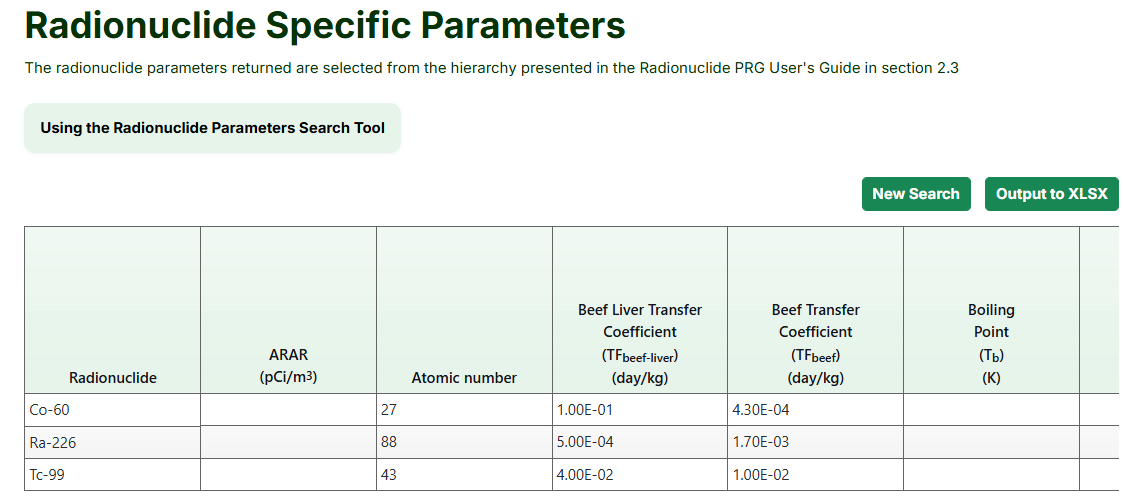
- Select the applicable parameter values or press the "Select All" button. The image below shows some of the available values.
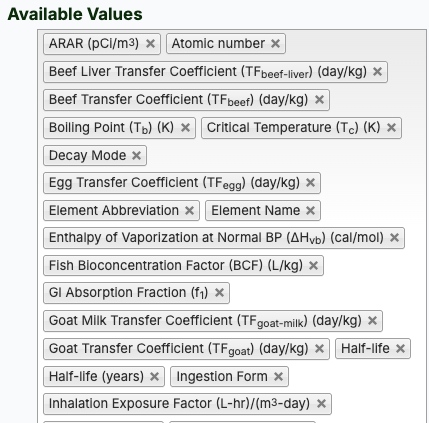
- Press the "Retrieve" button.
- The following page displays a table with selected parameter values, which can be downloaded by clicking the “Output to XLSX” button.
MODULE #10: Radionuclide Tools: Risk Characterization
Radionuclide Risk Calculator
Radionuclide risks are calculated by selecting ROPCs together with the applicable media, land use, and exposure route combination. Equation and exposure parameters used for the calculations can be found in the Radionuclide Risk Calculator User Guide.
For this tutorial, we will continue the example hypothetical situation involving exposure to radionuclides at an office building (Site B). Site B is a 0.5-acre (2000 m2) site in Phoenix, AZ that will be staffed with indoor workers who will be exposed to soil and groundwater. After the PRG screening step, we were left with three ROPCs: Co-60, Ra-226, and Tc-99 (see Tables 9 and 10 in Module 7).
Using the Radionuclide Risk Calculator
- Select Risk Calculator from the Radionuclide Tools menu.
- There is an option to enter the title of your project for the downloadable XLSX of output values.

- Select the applicable land use scenario and media. (For the hypothetical example, select Indoor Worker (the receptor group of concern), Soil, and Tap Water.)
- Select Radionuclide Data Source.
- "Database hierarchy defaults" uses the default slope factors and the radionuclide-specific parameters (from the hierarchies described in sections 2.3.1 and 2.3.2 of the User's Guide, respectively) but allows users to alter equation parameters.
- "User-provided" allows users to review/alter the slope factors and radionuclide-specific parameters as well as equation parameters.
- For the example test case, select "Database Hierarchy Defaults".
- Select the applicable units. Note that pCi is the default unit in the Unites States while Bq is used internationally.
- Select Radionuclides of Interest from the “available” box or press the "Select All" button. (For this example, select our ROPCs: Co-60, Ra-226, and Tc-99.)
- Click the “Display Risk/HI Output in Percentage” checkbox to generate separate tables that shows each analyte’s percent contribution to total risk.
- Press the "Retrieve" button.
- On the next screen, enter the media concentrations for the selected radionuclides. Remember to enter a period (.) in any cells that have no data. (For our example, use the Maximum Detected Concentrations from Tables 8 in Module 7.)

- Below the media concentration table are the exposure assessment details that can be modified as needed. Follow these steps for the test case example:
- The area of Site B is 0.5 acres or 2,000 m2. Go to the “Site Area (m2) for ACF“ dropdown under Exposure to Soil and choose “2000”.
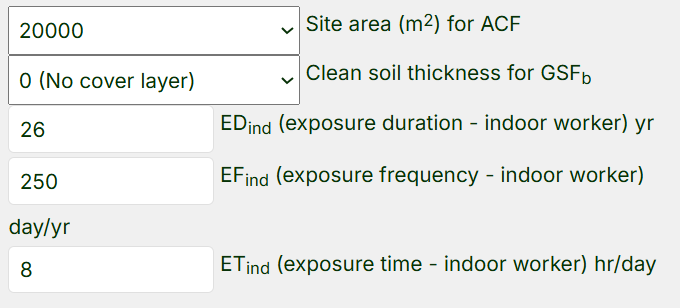
- Next, scroll down to the PEF equation and select “Phoenix, AZ” in the “City” dropdown. (Note that the default value for “As (acres)” for the PEF is 0.5, the same as Site B, so this can remain unchanged.)

- Leave all other parameters as is.
- View any equations by selecting the blue links. The tap water immersion route equation is displayed below.

- Press the "Retrieve" button. Results are presented in the next screen, organized by exposure media.
- Review the exposure parameters at the top of each Result section to compare site-specific changes to the default values.
(For our example, you should see changes to the soil input parameters.)

- In the risk result tables, click an isotope hyperlink (indicated with a green box in the image below) to view the decay chain data tables and an interactive time-series decay plot.
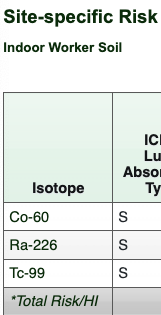
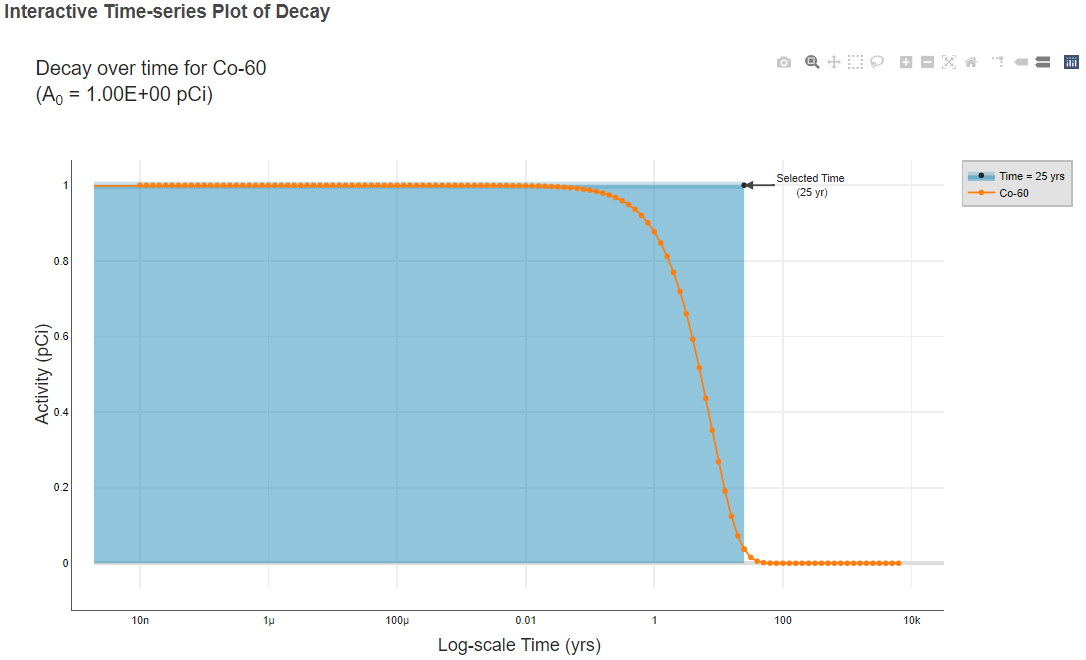
- Review the risk results for each medium.
Evaluation of Radionuclide Risk Calculator Results
For the hypothetical radionuclide contamination scenario, the next step for the baseline risk assessment would be to evaluate the risk calculator outputs and determine next steps. The total soil and total tap water risks, as well as percent contribution to total risk results, are summarized and reproduced below for each medium and exposure pathway.
Table 11: Summarized Radionuclide Risk Results for Soil

Table 12: Summarized Radionuclide Risk Results for Tap Water

The risk results are color coded to identify risk ranges and potential radionuclides of concern (ROCs):
Risk Range:
- Risk < 0.000001 (1E-06): No shading
- Risk > 0.000001 (1E-06): Orange
- Risk > 0.0001 (1E-04): Red
The risk calculator results indicate that all three contaminants may be ROCs. More information about the output of the radionuclide risk calculator can be found in Section 2 of the Radionuclide Risk Calculator Users Guide.
MODULE #11: Documentation/References
Documentation
After the risk assessement steps are complete, the user must document the risk assessment process. The purpose for documentation is to:
- Determine if additional action is necessary at the site,
- Provide a basis for determining residual chemical levels that are adequately protective of public health,
- Provide a basis for comparing potential health impacts of various remedial alternatives, and
- Help support selection of the "no-action" remedial alternative, where appropriate.
The EPA has published guidance for documentation purposes entitled "Risk Assessment Guidance For Superfund (RAGS): Volume 2 Human Health Risk Evaluation - Part D, Standardized Planning, Reporting, and Review of Superfund Risk Assessments". This guidance provides standardized tables for presentation of all risk results, including COPCs, background, ARARs, toxicity values, toxicity information (e.g., critical effects, target organs, uncertainty factors), excess lifetime cancer risks, hazard indices, and chemicals of concern (COCs). Check with your Regional Program Manager, Stakeholders, and state regulatory agencies to see if this guidance is applicable to your site.
In general, the risk assessment documentation includes sections/chapters containing the following: introduction, data evaluation, exposure assessment, toxicity assessment, risk characterization, summary of risks, conclusions, and remedial goal options. The RAGS Part D guidance standardizes the format of the tables presented within each of these sections of the risk assessment report/documentation.
References
EPA, 1988. Federal Guidance Report No. 11: Limiting Values of Radionuclide Intake and Air Concentration and Dose Conversion Factors for Inhalation, Submersion, And Ingestion. EPA 520-1-88-020. Office of Radiation Programs, U.S. Environmental Protection Agency, Washington, D.C., September.
EPA, 1993. Federal Guidance Report No. 12: External Exposure to Radionuclides in Air, Water, and Soil. EPA 402-R-93-081. Office of Radiation and Indoor Air, U.S. Environmental Protection Agency, Washington, D.C., September.
EPA, 1999. Federal Guidance Report No. 13: Cancer Risk Coefficients for Environmental Exposure to Radionuclides. EPA 402-R-99-001. Office of Air and Radiation, U.S. Environmental Protection Agency, Washington, D.C., September.
EPA, 2003. Human health toxicity values in Superfund risk assessments. OSWER Directive 9285.7-53. Office of Solid Waste and Emergency Response, U.S. Environmental Protection Agency, Washington, D.C., December 5.
ICRP, 2008. Nuclear Decay Data for Dosimetric Calculations. ICRP Publication 107. Ann. ICRP 38 (3). https://www.icrp.org/publication.asp?id=ICRP%20Publication%20107.
ORNL, 2014. Calculation of Slope Factors and Dose Coefficients. ORNL/TM-2013/00. Center for Radiation Protection Knowledge, Oak Ridge National Laboratory, Oak Ridge, Tennessee.